ARTICLE AD BOX
In May, the meme coin market experienced a rally. This was partly fueled by the surge in the general altcoin market following the US Securities and Exchange Commission’s approval of eight spot Ethereum exchange-traded funds (ETFs).
As we enter June, some meme assets, such as Super Trump (STRUMP), Pepe (PEPE), Bitcoin native memecoin DOG•GO•TO•THE•MOON (DOG), ANDY ETH (ANDY), and Floki (FLOKI), are poised to extend their gains.
Super Trump (STRUMP) Climbs Higher
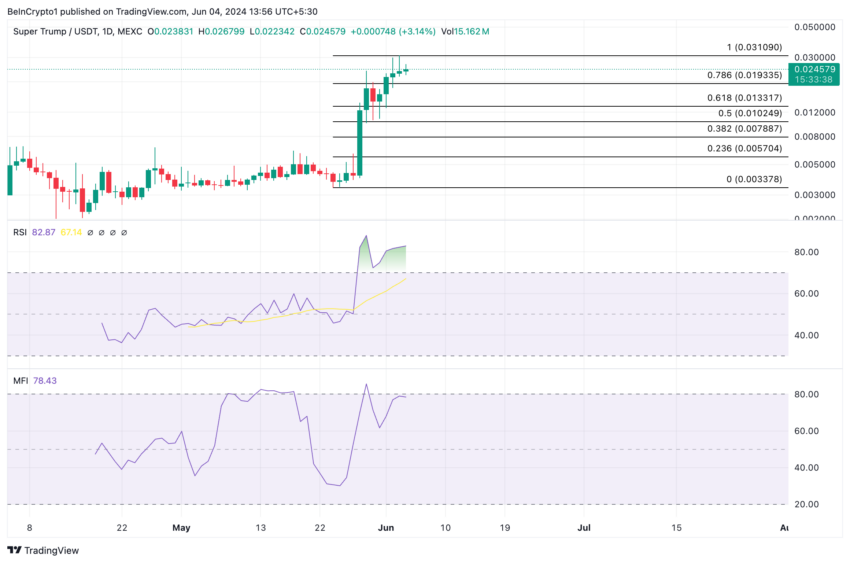
As of this writing, Super Trump traded at $0.025. The meme coin’s value has increased by over 400% in the last week.
Its key momentum indicators assessed on a 1-day chart confirmed that STRUMP’s price surge has been backed by real demand from market participants. For example, its Relative Strength Index (RSI) was 82.87, while its Money Flow Index (MFI) was 78.43.
An asset’s RSI measures the momentum of its price movements, while its MFI considers price and volume to assess buying and selling pressure.
While the values of these indicators suggested that STRUMP’s buying momentum has outweighed distribution, it is key to note that an RSI value above 70 generally indicates that an asset is overbought. This means that STRUMP’s price may have risen too quickly and could be due for a correction.
If buyers’ exhaustion sets in and a decline ensues, the meme coin’s value may plummet to $0.019.
 Super Trump Analysis. Source: TradingView
However, if this is invalidated and the uptrend continues, STRUMP may rally to exchange hands at $0.031.
Pepe (PEPE) Aims to Put Buyers in Profit
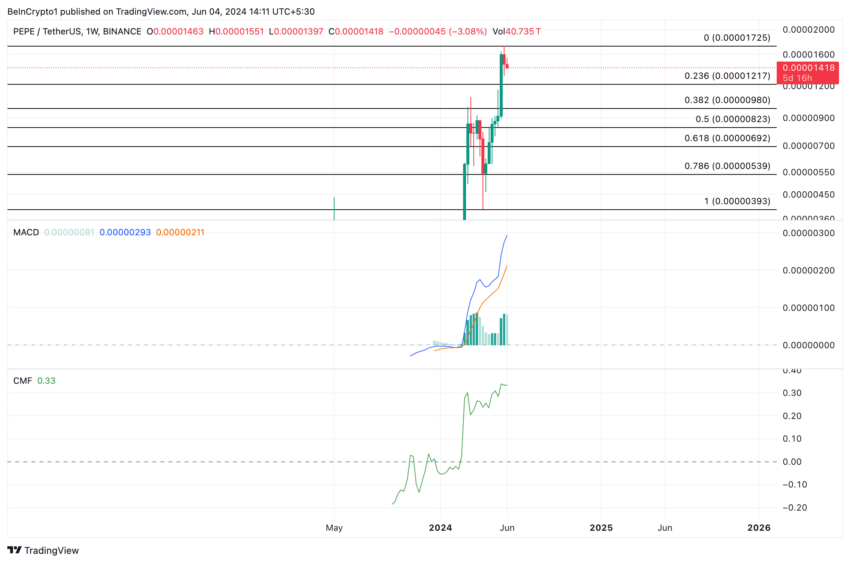
The price of the frog-themed meme coin Pepe (PEPE) has surged by 63% in the past 30 days. Readings from its Moving Average Convergence/Divergence (MACD) indicator observed on a weekly chart showed that the bullish bias toward the altcoin exceeded the bearish sentiments.
As of this writing, PEPE’s MACD line (blue) rested above its signal line (orange). This indicator gauges an asset’s price trends, momentum, and potential buying and selling opportunities in the market.
When its lines are set up this way, it is a bullish signal, which means that buying pressure is higher than selling activity. Traders interpret it as a sign to take long and exit short positions.
Further, PEPE’s rising and positive Chaikin Money Flow (CMF) confirmed the bullish trend. At 0.33, PEPE’s CMF signaled an uptick in liquidity inflow into the meme coin market.
This indicator tracks how money flows into and out of an asset’s market. A positive CMF value is a sign of market strength.
If PEPE buyers maintain their demand for the meme coin, its price may reclaim its all-time high of $0.00001718, recorded on May 27.
Read More: Pepe: A Comprehensive Guide to What It Is and How It Works
 Pepe Analysis. Source: TradingView
However, if the bears re-emerge to regain control, selling pressure may cause PEPE’s price to fall toward $0.000012.
DOG•GO•TO•THE•MOON (DOG) Sits at an All-Time High
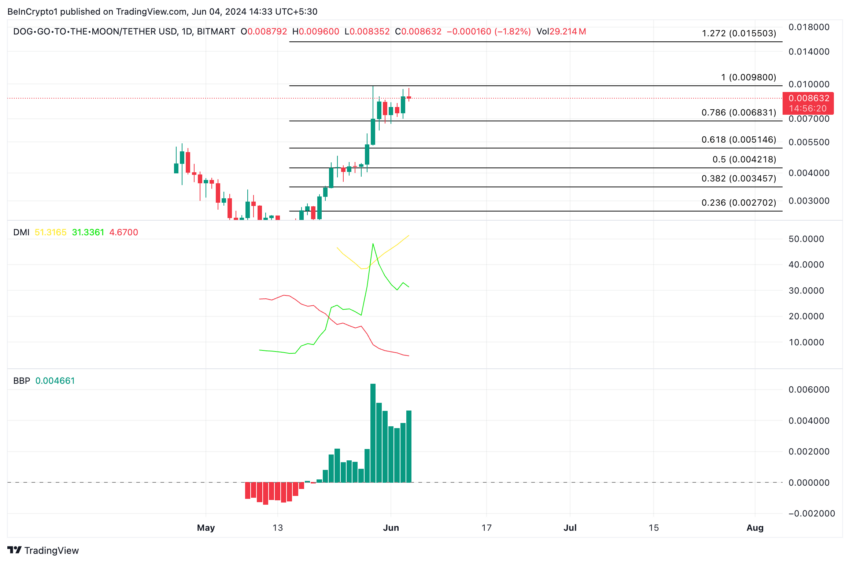
In the early trading hours of today, DOG•GO•TO•THE•MOON (DOG) climbed to an all-time high of $0.00962. As of this writing, it has since retraced by 10% to exchange hands at $0.008795.
Despite the slight profit-taking activity, the meme coin’s price has increased 20% in the past 24 hours. DOG’s Elder-Ray Index’s positive value suggested that the bulls remain in control.
This indicator measures an asset’s buying and selling pressure. Traders use it to gauge market sentiment and identify potential trends and reversals. When its value is positive, it means that bull power dominates the market.
Confirming the strength of the bulls, DOG’s positive directional index (green) rested above its negative index (red) at press time. This suggested that buying pressure was stronger than selling pressure, confirming the possibility of a further price rally.
If this accumulation momentum is maintained, DOG’s price may reclaim its all-time high and climb to $0.015.
 DOG•GO•TO•THE•MOON Analysis. Source: TradingView
However, if profit-taking gains momentum, its price might slip under $0.09 to trade at $0.068.
ANDY ETH (ANDY) Trades Above Key Moving Average
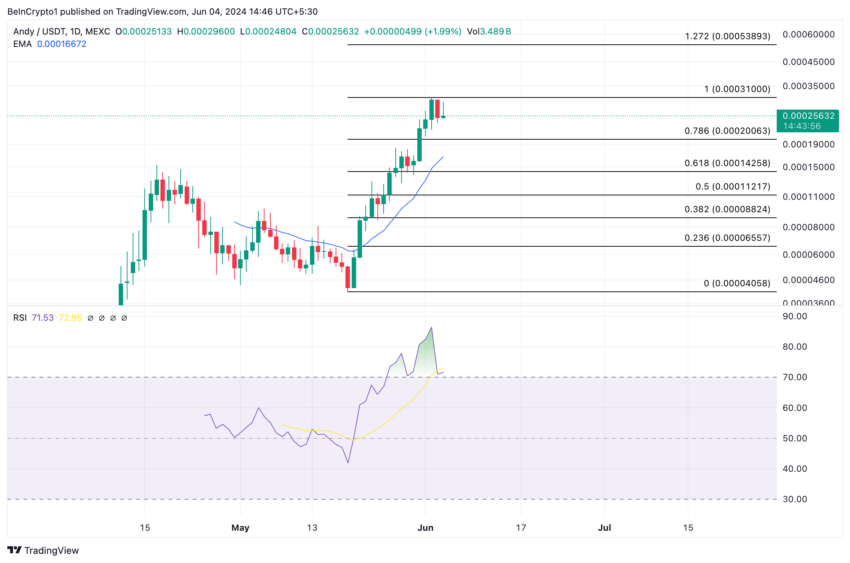
Exchanging hands at $0.00025, ANDY trades above its 20-day Exponential Moving Average (EMA).
When an asset trades above this key moving average, it is seen as a bullish signal. This means the asset’s current price has rallied past its average price in the past 20 days. Traders view it as a shift toward coin accumulation.
ANDY’s rising RSI confirms the accumulation trend. At press time, the indicator’s value was 71.39, suggesting that buying pressure outpaced token sell-offs.
If accumulation continues to climb, ANDY’s next price point is $0.0005, above its all-time high of $0.0003005.
 ANDY ETH Analysis. Source: TradingView
However, if many of its traders begin to make a profit at this point, ANDY’s price may fall to $0.00014.
Floki (FLOKI) Seeks to Maintain Ascending Channel
Since April 15, the uptick in Floki’s (FLOKI) buying pressure has caused it to trend within an ascending channel.
When an asset trades within this channel, there is more buying pressure than selling pressure.
The rise in FLOKI’s demand in the past few weeks can be gleaned from its Awesome Oscillator. Since May 13, FLOKI’s Awesome Oscillator has posted only green-upward facing bars.
This indicator measures an asset’s market momentum and identifies its price trends and reversal points. When it returns green upward-facing bars, buyers control the market, and the price rally might continue.
If FLOKI’s rally continues, its next price point is $0.004.
Read More: What Are Meme Coins?
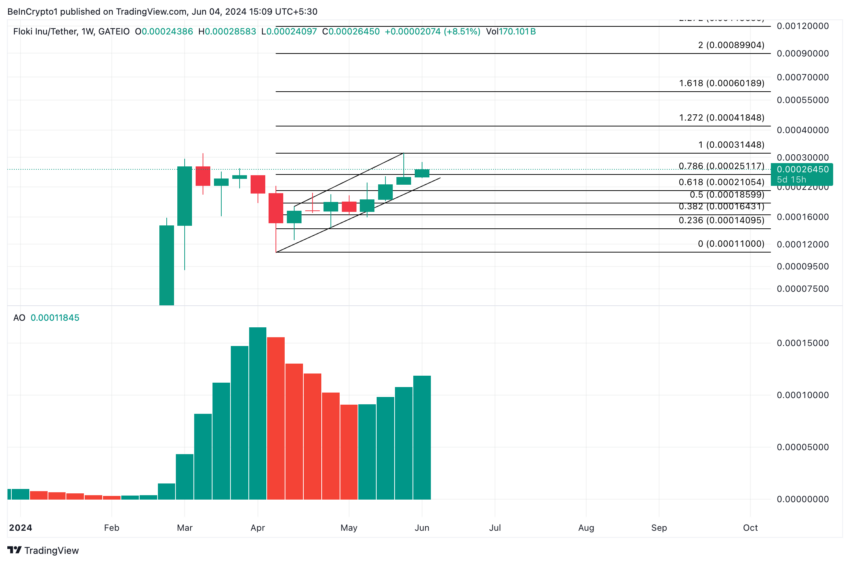 Floki Analysis. Source: TradingView
However, invalidating this means the meme coin’s price may fall to $0.0025.
The post 5 Meme Coins to Watch in June 2024 appeared first on BeInCrypto.
.png)
 5 months ago
3


 English (US)