.png)
 3 hours ago
3
3 hours ago
3
ARTICLE AD BOX
The post After Plunging Below $90,000, Has the Bitcoin Bull Run Come to an End? Here’s What You Should Know appeared first on Coinpedia Fintech News
U.S. President Donald Trump has re-instigated the ‘Tariff war’ by imposing 25% tariffs on Canada and Mexico. With this, the stock markets and crypto markets have been hit hard as the global market capitalization of cryptos has dropped below $3 trillion. With this, the Bitcoin price has plunged below $89,000 for the first time since the November 2024 rise. The market sentiments have turned extremely bearish, which suggests more downfall is expected to occur that may drag the BTC price below the crucial support.
Will the BTC Price Plunge Below $85,000?
The bearish dominance over Bitcoin and crypto markets has escalated, dragging the price below $89,000. The market sentiments have plunged to 25 and reached levels they remained at during the FTX crash. Besides this, the price has reached the neckline of a huge bearish pattern, which hints towards a more bearish outlook for the star token.
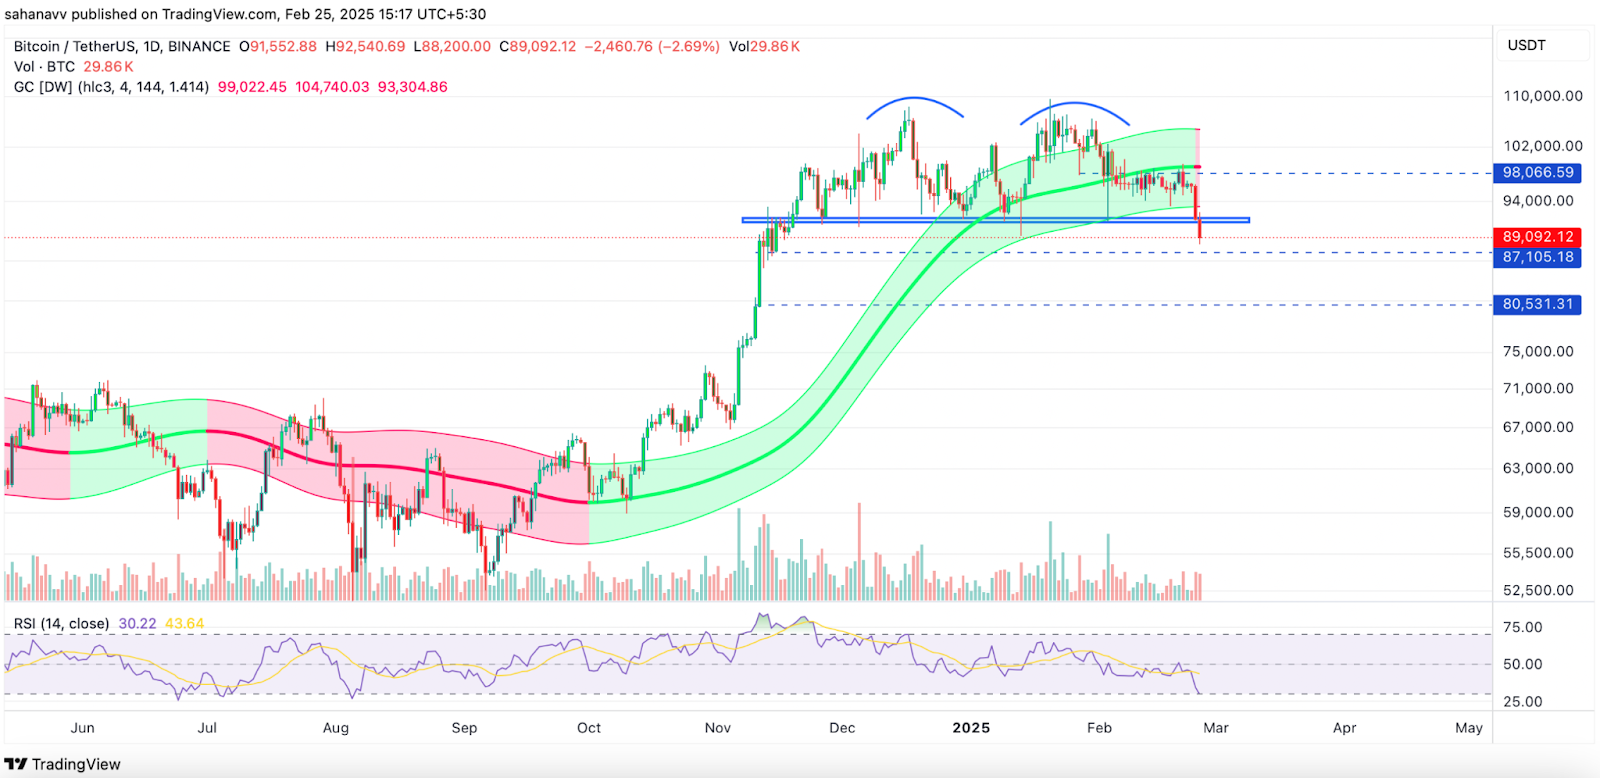
The daily chart of BTC shows the price has dropped below the neckline of a massive ‘m-shaped’ or a double-top pattern. Moreover, the Gaussian channel has also turned bearish after remaining bullish since October 2024. Besides, the RSI has reached the lower threshold and displays the possibility of entering the oversold levels. The daily RSI has never dropped within the oversold levels since August 2023 and if the panic selling continues, the BTC price is feared to drop to support close to $80,000.
Is the Bitcoin Bull Run Over?
In the longer time frame, the Bitcoin price displays some possibly strong rebound but the rally is expected to remain under bearish influence. Besides, the token is reciprocating a previous pattern, which displays a strong rebound is fast approaching. However, the price is required to enter the demand zone, which is 3% to 4% lower than the current levels.
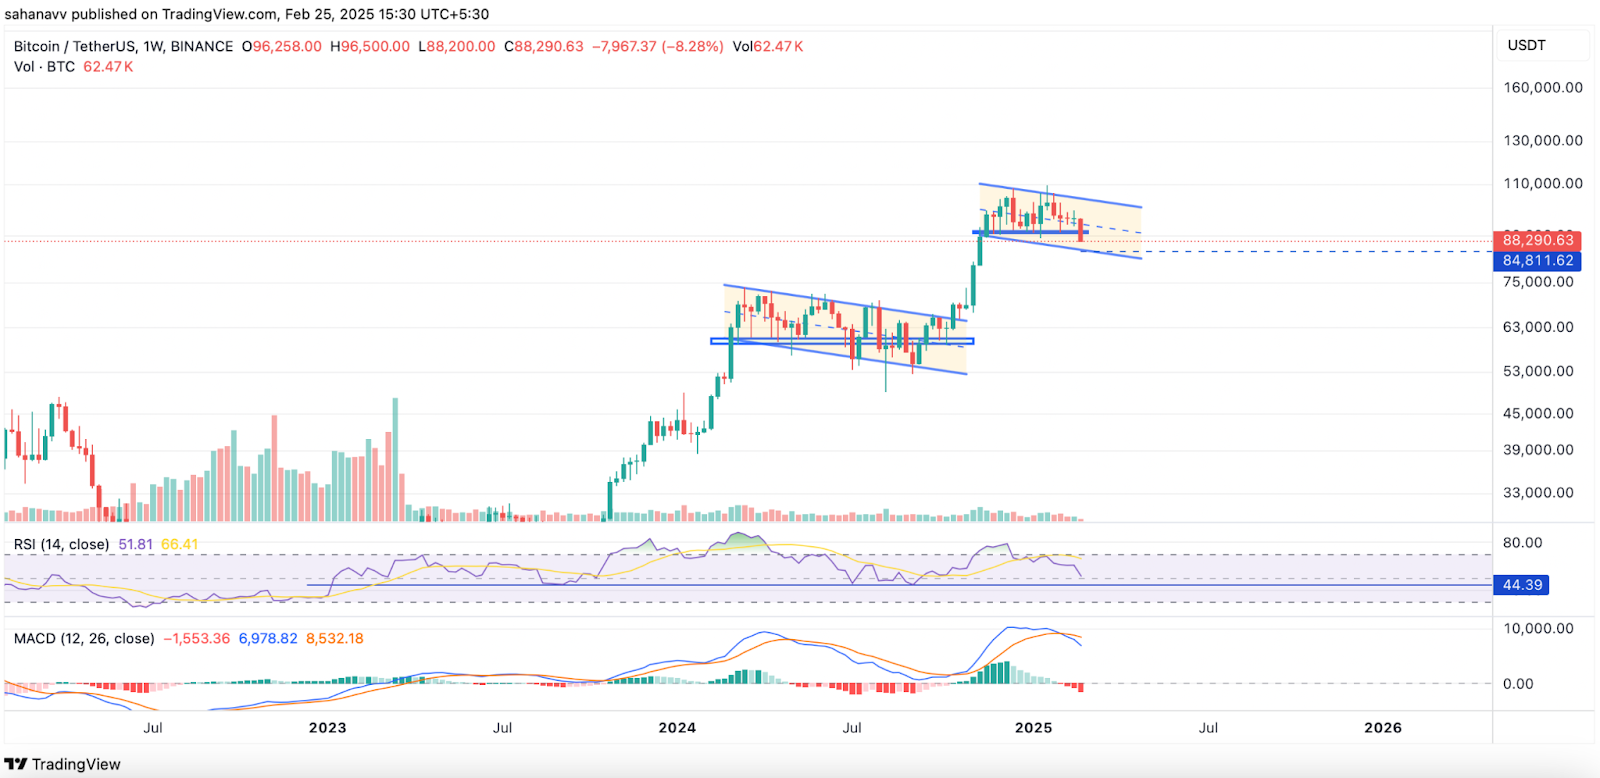
In the long term, the BTC price is yet again trading within a descending parallel channel as it did in the first few weeks of 2024. The price maintained its volatility within the pattern and marked the interim lows below $54,000, which triggered a huge upswing to a new ATH above $109K. A similar pattern is seen currently where the price is heading towards the support of the channel which is just below $85,000. The RSI is deflating and could drop to support at 44.39, while the weekly MACD suggests a rise in the selling pressure.
As the MACD remains within a positive range, a quick rebound is expected, which could ease the selling pressure. With this, the RSI is also expected to defend the support and trigger a rebound, which could initiate a recovery phase. However, a breakout beyond the channel may only trigger a strong bull run, which may pave the way for a new Bitcoin (BTC) price ATH probably above $112,000.


 English (US)