ARTICLE AD BOX
Algorand’s (ALGO) price reached a monthly low of $0.15 on Tuesday, June 11, despite trading around $0.18 in early June. On-chain analysis examines the token’s potential, highlighting indicators that may drive ALGO’s price action.
In March, ALGO followed the broader altcoin rally, reaching a yearly peak of $0.31. However, as the market fell to the demand of bearish forces, so did ALGO. Is the token ready for respite, or is a further downtrend in the works?
Algorand Sellers on the Sidelines
BeInCrypto examines the Order Books of 11 crypto exchanges to gain insight into this. Employing this metric, one can ascertain whether investors plan to sell off many tokens or buy them.
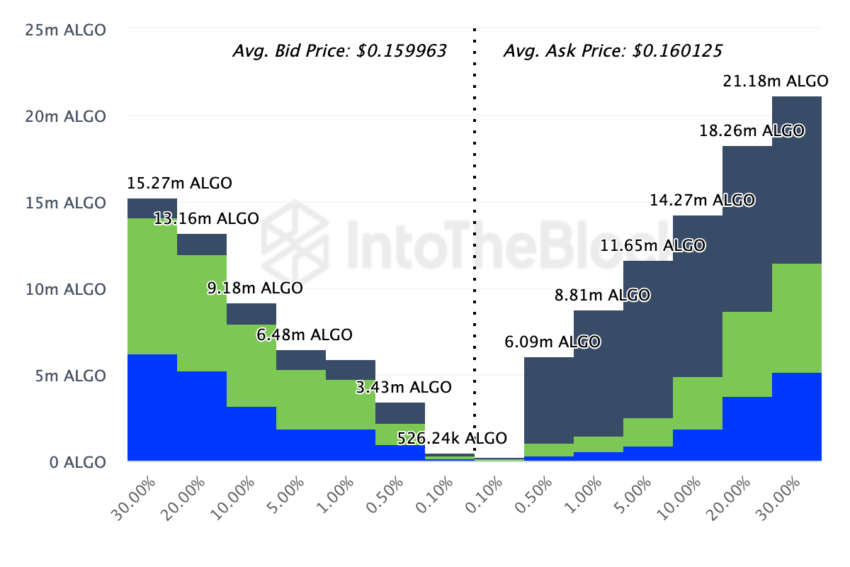
The Order Books have the “bid” and “ask” segments, as shown below. In simple terms, a bid is a price level at which traders are willing to buy a cryptocurrency. The opposite is ask, which describes prices targeted at selling.
According to data obtained from IntoTheBlock, Algorand investors have placed bids to buy 53.97 million tokens. At an average price of $0.16, those assets are worth $8.09 million.
 Algorand Order Books On Exchanges. Source: IntoTheBlock
On the other side of the divide, another set lined up to sell a staggering $80.27 million ALGO. This average asked price was $0.16, meaning the value that could be sold is $12.84 million.
Therefore, the significant difference between the buy and sell orders indicates that bears are in charge.
Read more: What Is Algorand (ALGO)?
Bearish Sentiment Lingers For Algorand
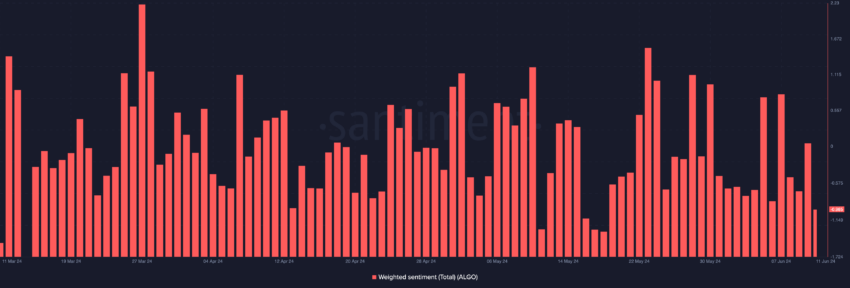
Furthermore, Santiment data revealed that the Weighted Sentiment around Algorand was negative. Weighted Sentiment tracks the level of positive or negative comments about a project. If the metric is positive, it means that the average market participant is optimistic.
This could lead to increased buying pressure and a possible price increase. Alternatively, a negative reading suggests that most participants share cynical opinions about a token.
In this instance, it becomes difficult for the price to bounce except on rare occasions where the negative sentiment becomes extreme.
 Algorand Weighted Sentiment. Source: Santiment
In summary, ALGO may attempt to revisit $0.16. However, the block of sell orders in that region and the bleak outlook may force a rejection. If this prediction plays out, Algorand’s price may slide further.
ALGO Price Prediction: Can It Slide to $0.14?
Besides the abovementioned indicators, the Global In and Out of Money (GIOM) supports this bearish forecast. In non-technical terms, the GIOM categorizes addresses based on those making money at a breakeven point and addresses holding at a loss.
With this metric, one can identify support and resistance regions. The larger the group, the more a price level can hold as resistance or support.
The chart below shows that 1.12 million addresses purchased 2.68 billion Algorand tokens at an average price of $0.19. This means that if ALGO approaches this sell-wall, holders may try to break even. Hence, this could be a resistance point for ALGO, and a rejection to $0.14 may be likely.
 Algorand (ALGO) GIOM and Price Prediction. Source: IntoTheBlock
However, one may need to look for Algorand’s network activity. For instance, the number of zero-balance and active addresses on the network has been increasing since June 10. Precisely, active addresses were 102.670 on June 11. Zero-balance addresses were, however, 37,980 on the same day.
Active addresses estimate the number of users on a blockchain, while zero-balance addresses measure the number of new wallets interacting with a network.
The increase in both metrics may be positive for Algorand. If the number continues to grow, it could invalidate the bearish theory.
Read more: Algorand (ALGO) Price Prediction 2024/2025/2030
 Algorand Active Addresses. Source: IntoTheBlock
In addition, one has to keep an eye on the $0.15 region. This could prevent ALGO from another downturn since millions of holders bought a ton of tokens at that price.
Beyond that, network activity has been the most intense in the same region this month. If these holders mount pressure on the token at this point, ALGO may bounce toward $0.17.
The post Algorand (ALGO) Price Recovery Looks Bleak as Sellers Line Up appeared first on BeInCrypto.
.png)
 5 months ago
2


 English (US)