.png)
 1 day ago
3
1 day ago
3
ARTICLE AD BOX
In an X post shared today, acclaimed cryptocurrency analyst Ali Martinez identified two key resistance levels that Ethereum (ETH) must reclaim to confirm a bullish trend reversal. Additionally, ETH is showing signs of bullish divergence on the daily chart, raising optimism among holders that a rally may be closer than expected.
Ethereum Must Overcome These Levels For Further Upside
Unlike rival cryptocurrencies such as Bitcoin (BTC), Solana (SOL), and XRP, ETH’s recent price action has disappointed most of its holders. The second-largest cryptocurrency by market capitalization is down 49.2% over the past year, in stark contrast to BTC’s 18.5% gain over the same period.
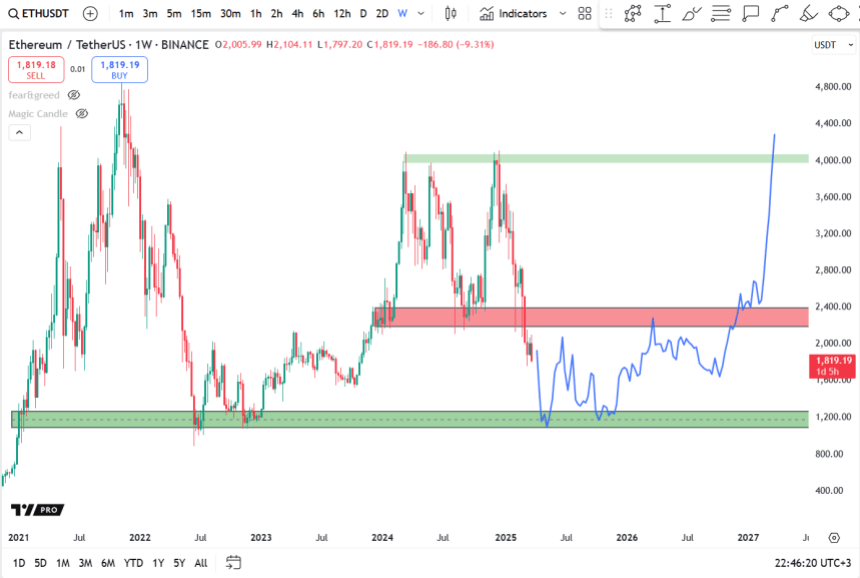
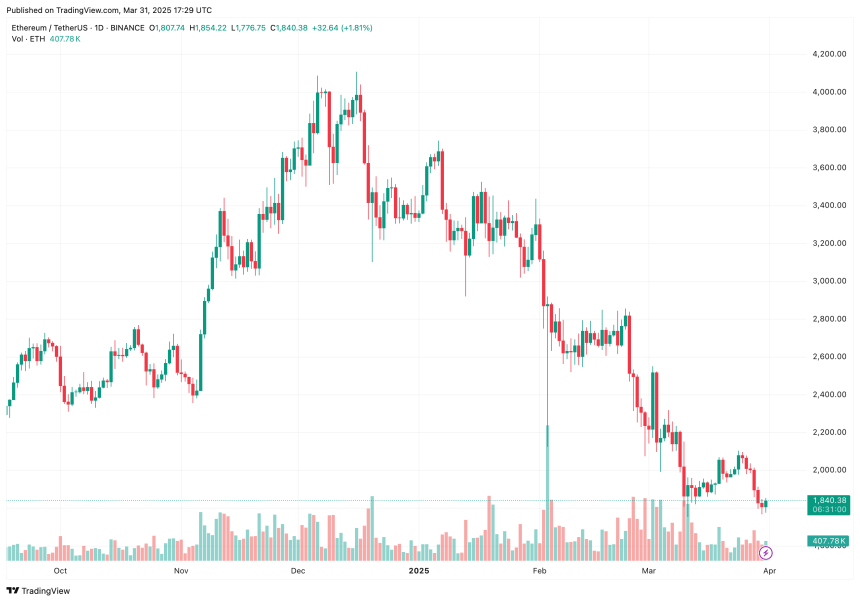
Sharing the following daily chart, Martinez highlighted two critical resistance levels that ETH must surpass to reverse its price trajectory. The analyst stated:
Ethereum $ETH needs to reclaim $2,100, and more decisively, $2,300, to confirm a bullish trend reversal. These are the levels to watch!
To recall, ETH last traded at the $2,100 level earlier this month on March 9. Interestingly, the digital asset also plunged to as low as $1,754 on the same day, its lowest price in more than a year.
After reclaiming $2,100, ETH will need to overcome the more significant $2,300 resistance level. A clear breakout above $2,300 could signal renewed bullish momentum.
Meanwhile, altcoin analyst @altcoinrookie shared a bearish forecast for Ethereum, predicting that ETH will dip to $1,200 by June 2025 before reaching new all-time highs (ATHs).
ETH Showing Signs Of Bullish Divergence
While these analyses suggest short- to mid-term challenges for ETH, crypto trader Merlijn The Trade provided a more optimistic outlook. The analyst shared the following ETH daily chart, noting that the asset is displaying bullish divergence.
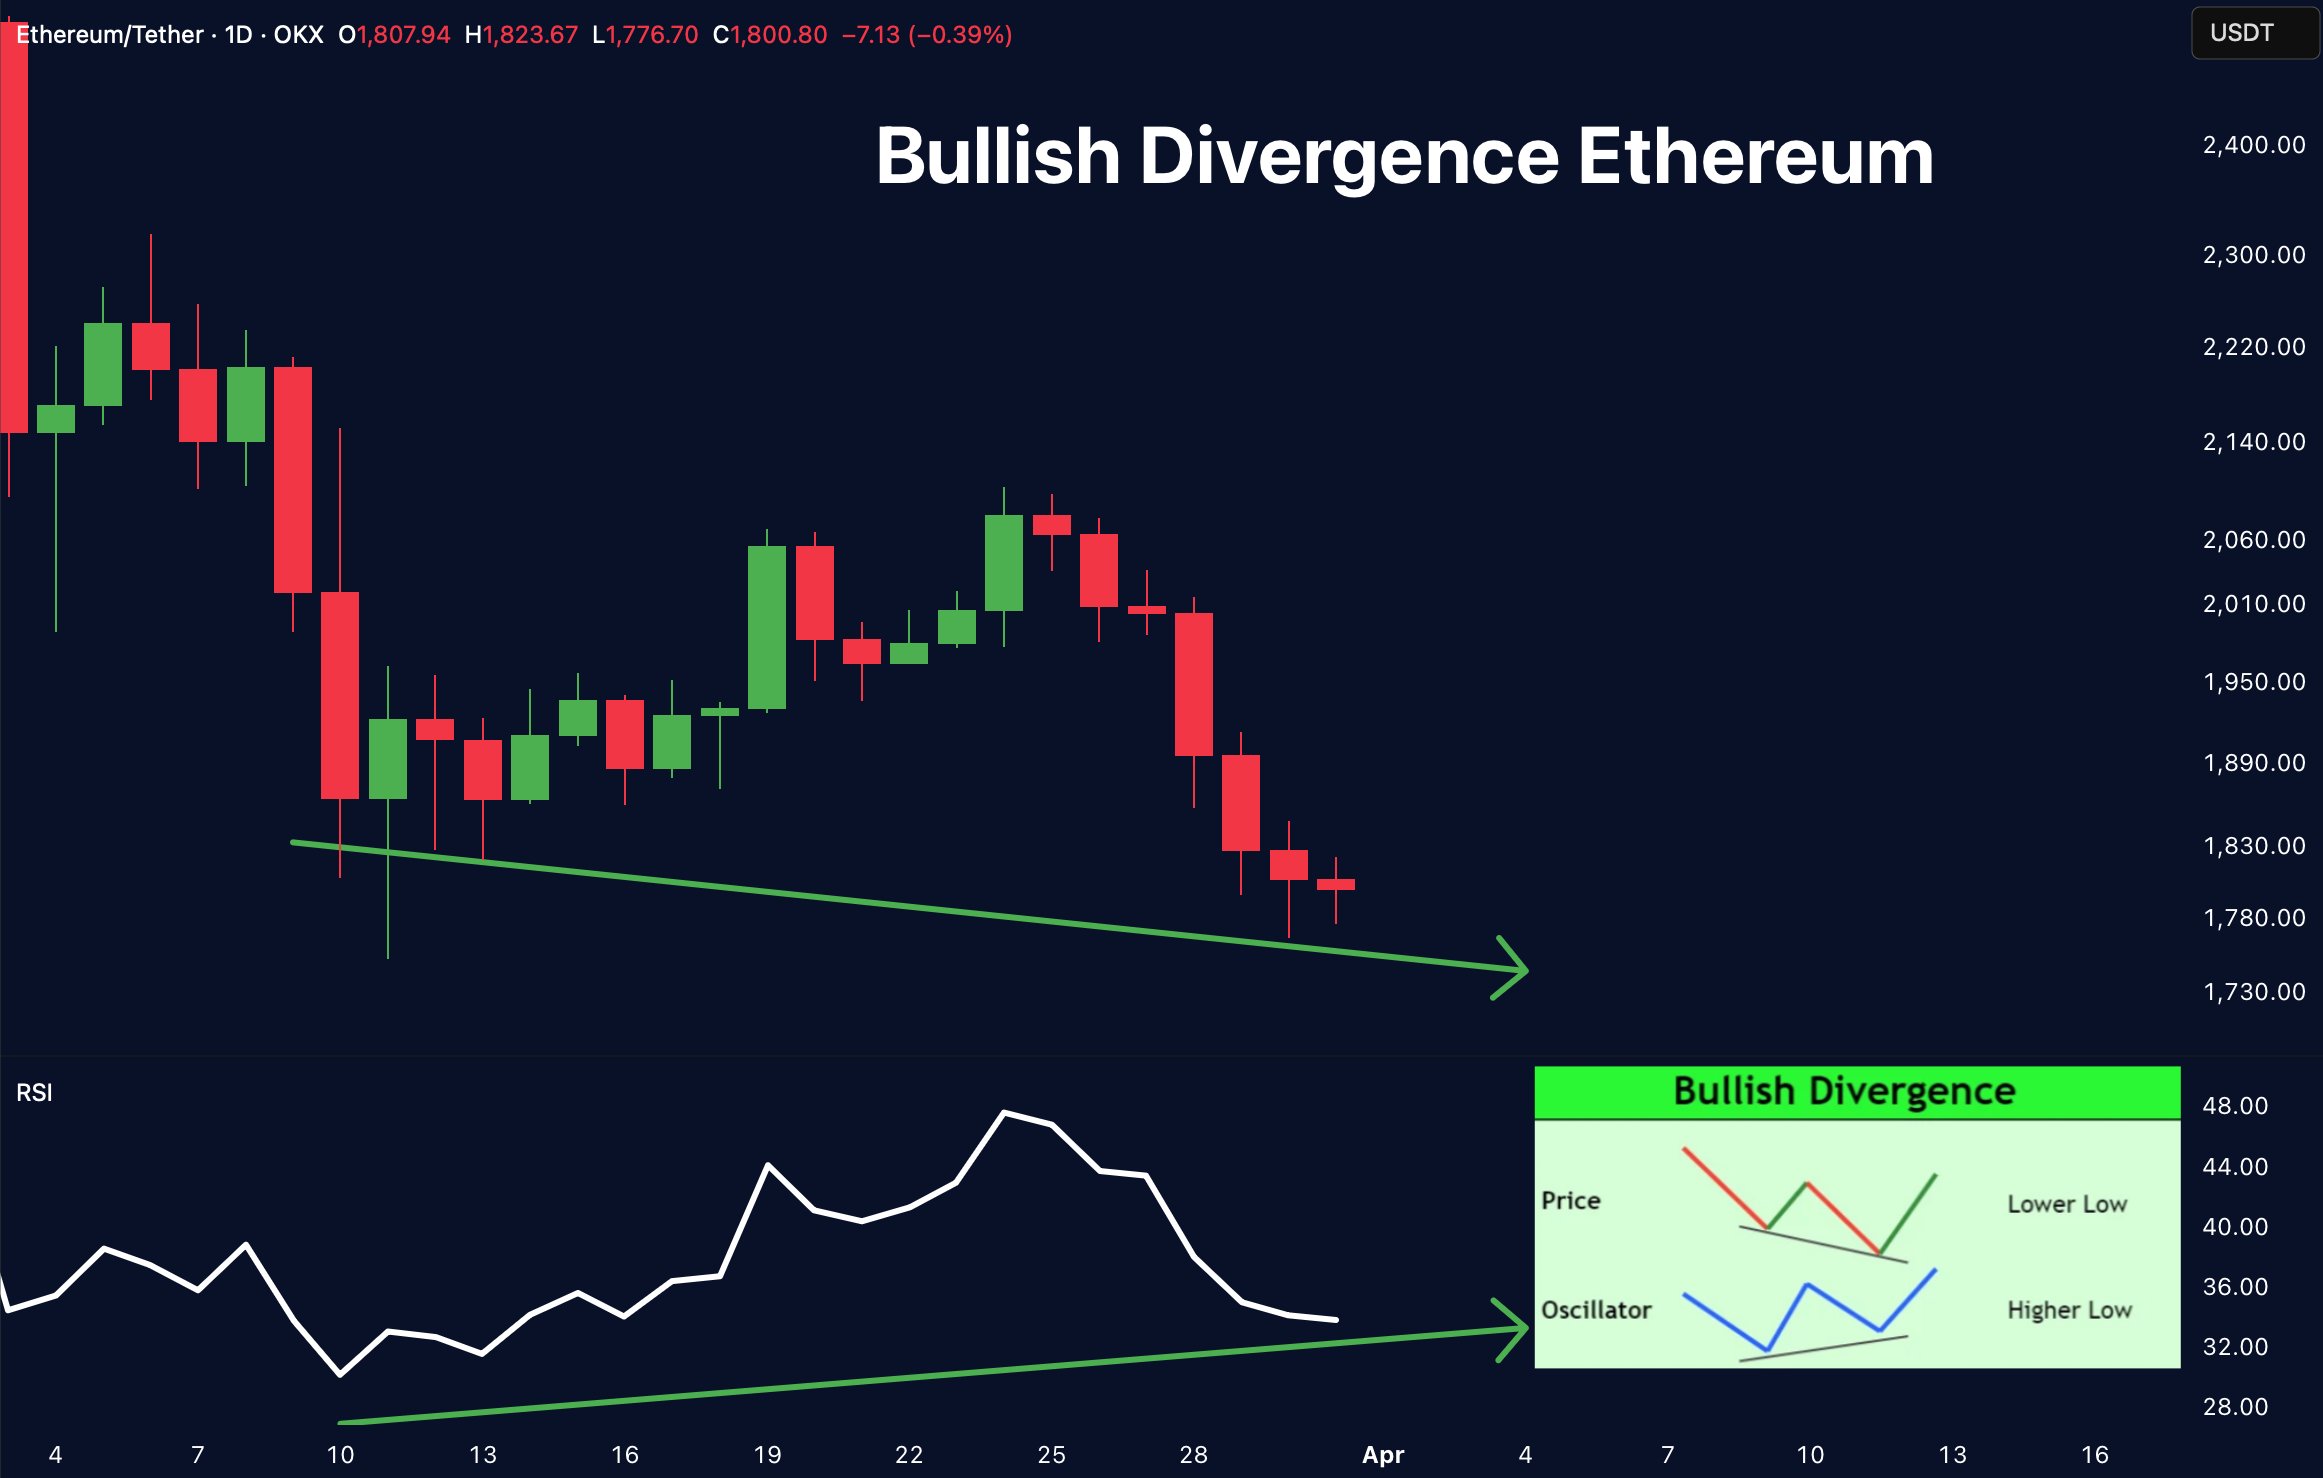
For the uninitiated, the RSI is a momentum indicator that helps traders and investors to determine when the underlying asset may be overbought or oversold. RSI bullish divergence occurs when the RSI forms higher lows while the price forms lower lows, indicating weakening selling pressure and a potential trend reversal to the upside.
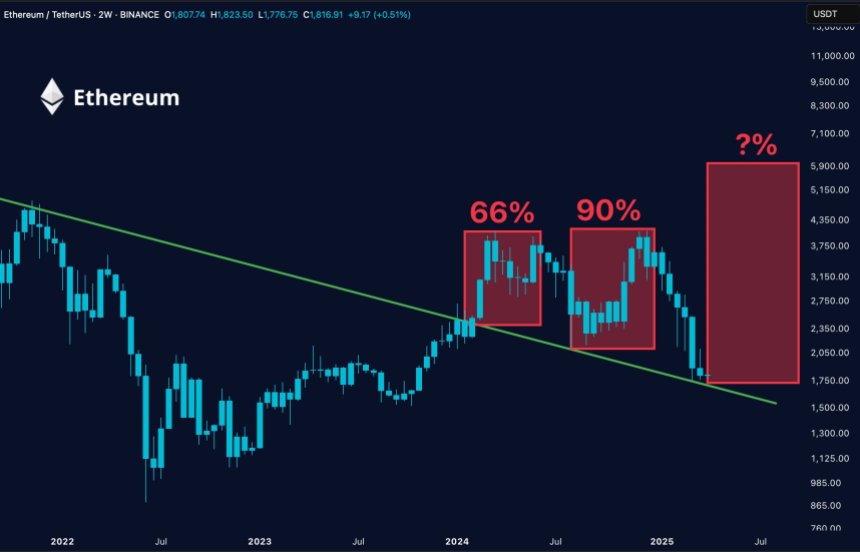
The trader further pointed out that although ETH’s price continues to make lower lows, its daily RSI is forming a contrasting trend. Merlijn also shared a two-week ETH price chart, highlighting how Ethereum has historically rebounded from a critical support level since early 2024, often posting significant returns after each bounce.
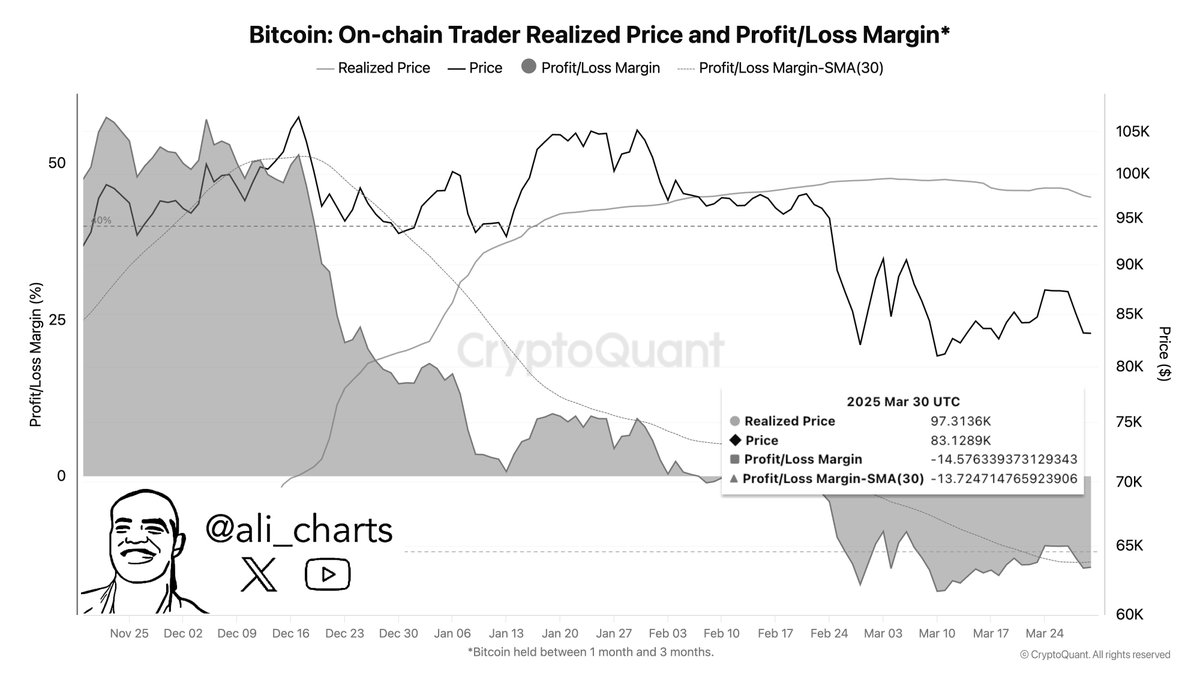
That said, rising ETH reserves on crypto exchanges remain a concern, potentially extending ETH’s price suppression. At press time, ETH trades at $1,840, up 2.1% in the past 24 hours.


 English (US)