ARTICLE AD BOX
Onchain Highlights
DEFINITION: This metric, compares the monthly average  of new addresses against the yearly average
  to underline relative shifts in dominant sentiment and help identify when the tides are turning for network activity.
Monthly  > Yearly
  indicates an expansion in on-chain activity, typical of improving network fundamentals and growing network utilization.
Monthly  < Yearly
  indicates a contraction in on-chain activity, typical of deteriorating network fundamentals and declining network utilization.
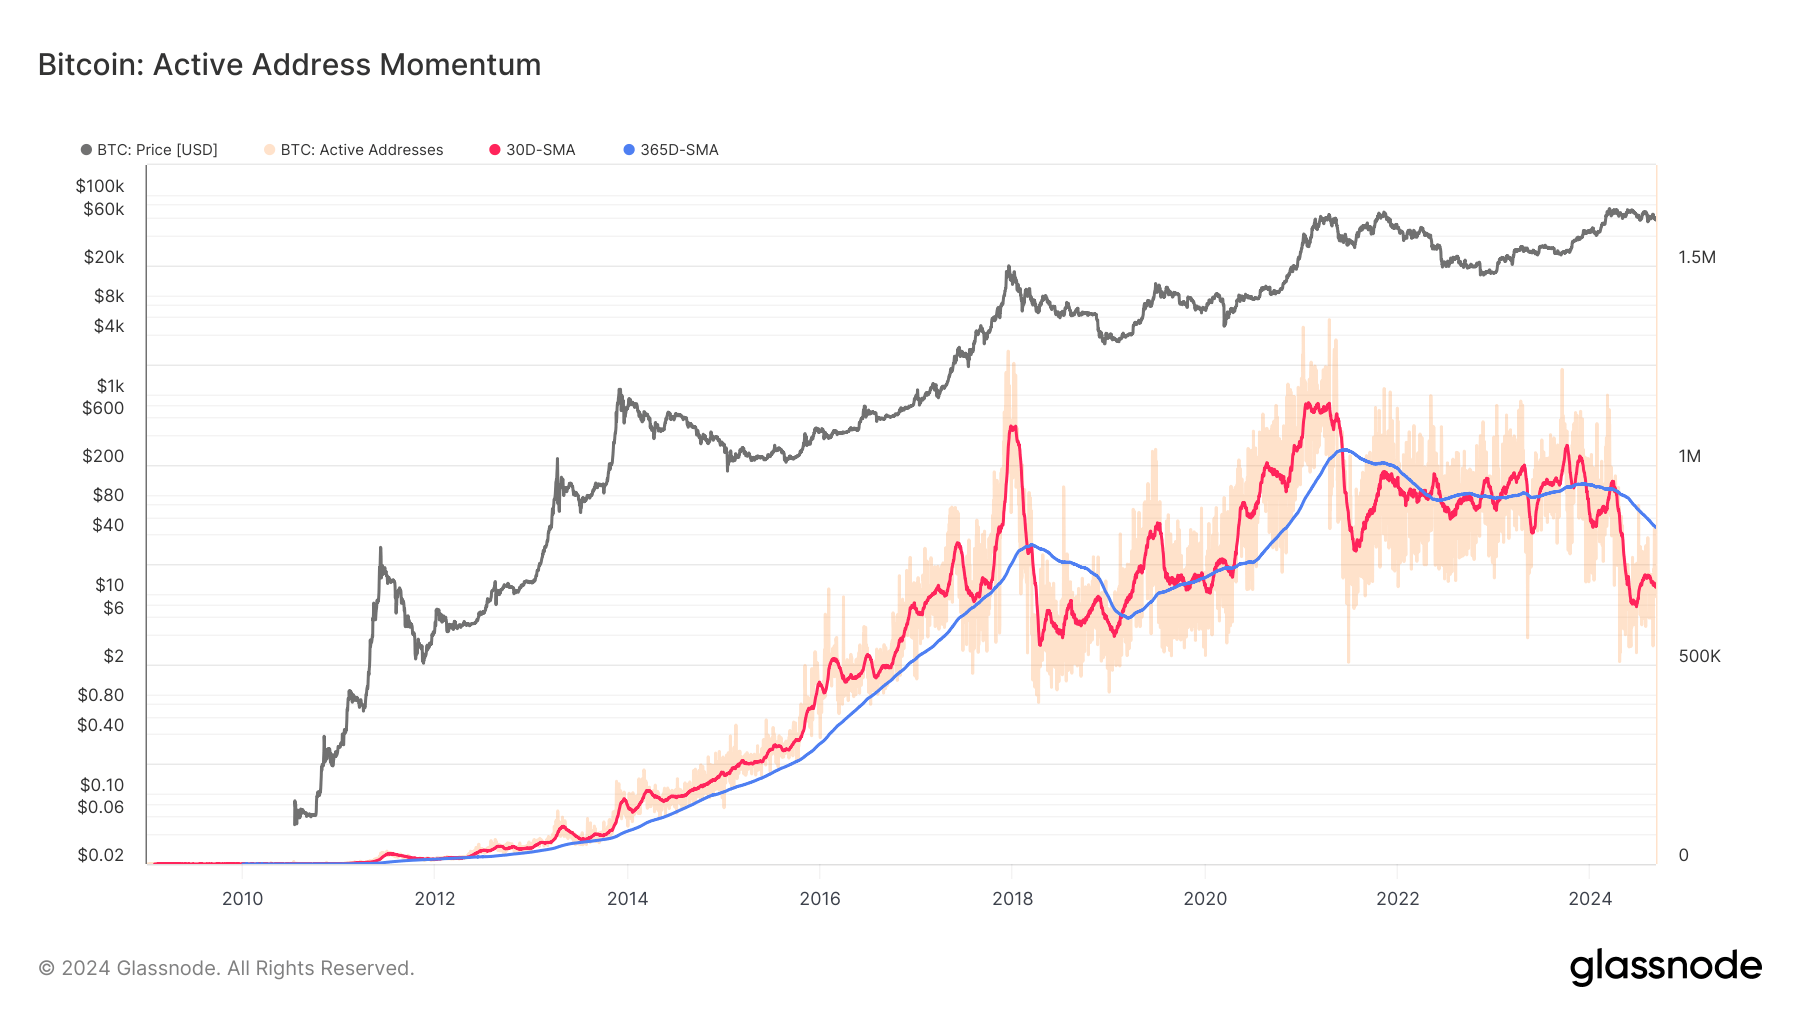
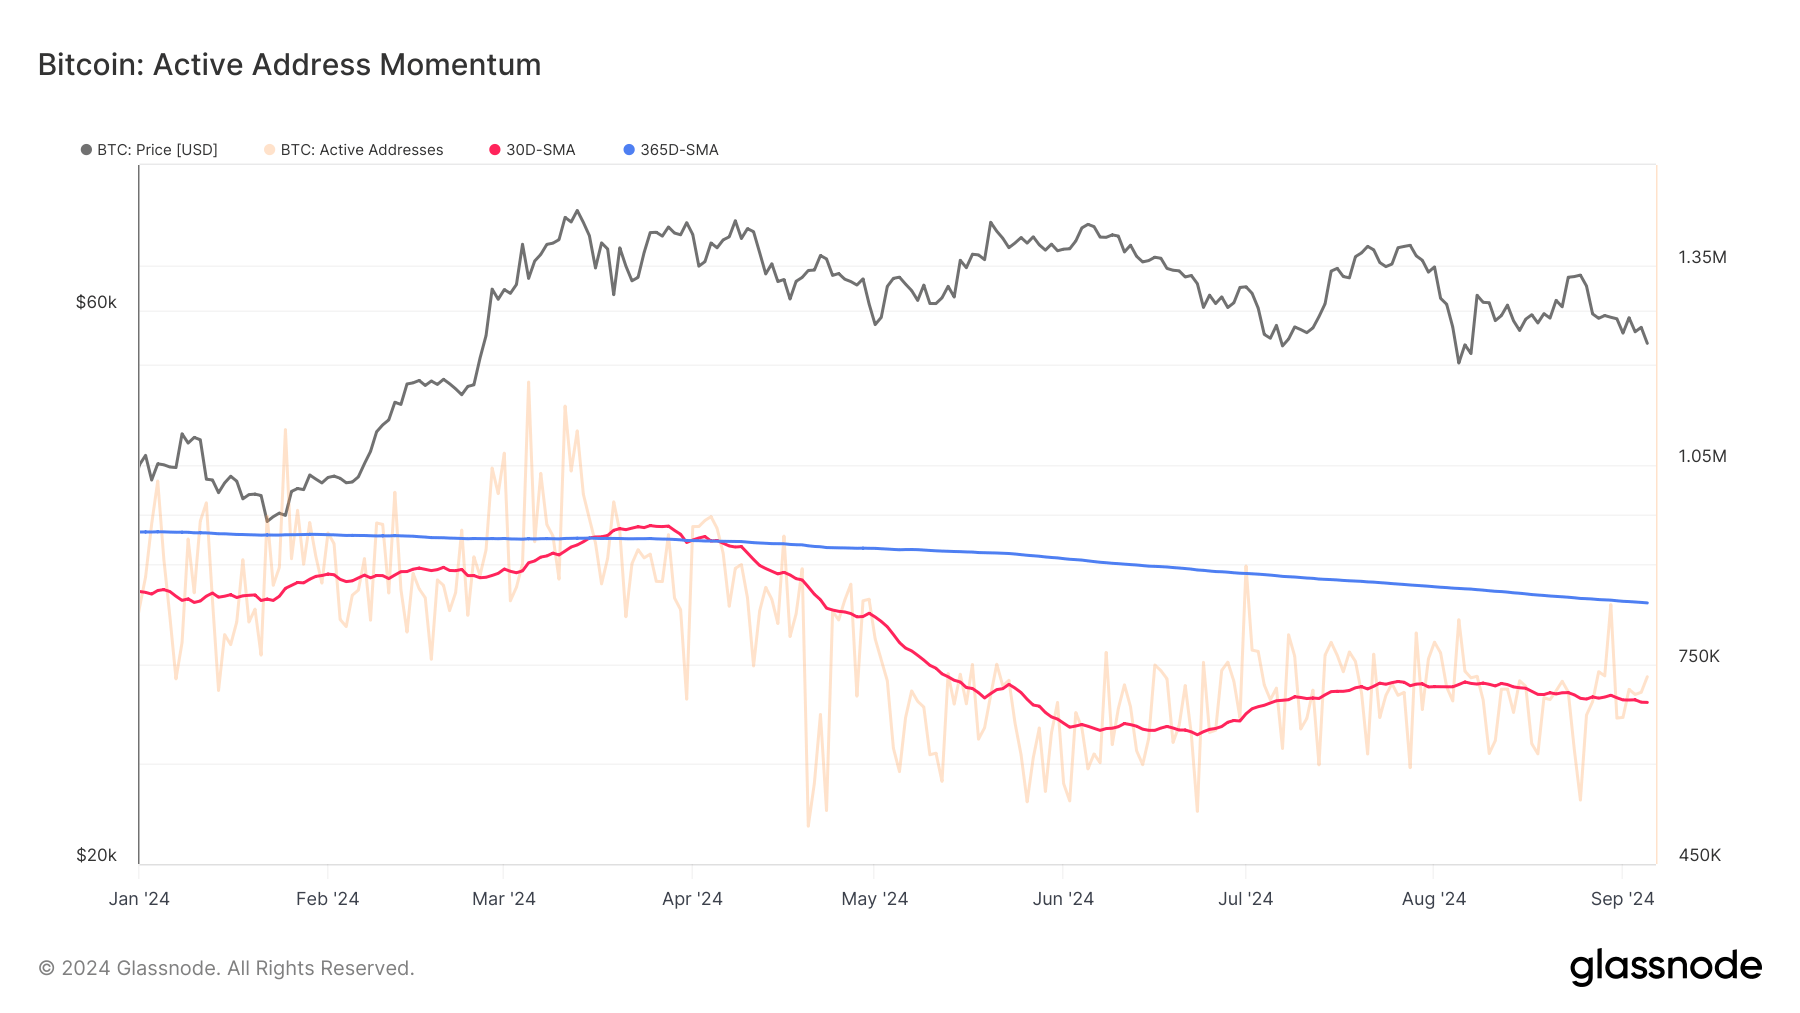
Bitcoin’s active address momentum shows a sustained decline through 2024, particularly in the months following the April halving event. The 30-day simple moving average (SMA) of active addresses has fallen below the 365-day SMA, marking a contraction in network activity.
Historically, similar trends were observed in 2018 and 2021, following Bitcoin’s major price peaks. During those periods, active addresses also fell, aligning with broader market cooldowns.
 Bitcoin: Active Address Momentum: (Source: Glassnode)
Glassnode data highlights that the monthly average of active addresses during 2024 has remained below the yearly average, pointing to declining user engagement. This trend echoes the downturn seen in mid-2018 when Bitcoin’s price corrected after its 2017 bull run.
Despite short-term price rallies, network activity has not rebounded in line with previous cycles. The contraction in active addresses, coupled with this year’s post-halving phase, suggests waning network demand for blockspace, potentially indicating a broader cooling of Bitcoin’s user base.
 Bitcoin: Active Address Momentum: (Source: Glassnode)
The post Bitcoin active address momentum slows, echoes post-peak declines of 2018 and 2021 appeared first on CryptoSlate.
.png)
 4 months ago
2


 English (US)