ARTICLE AD BOX

The post Bitcoin Below $70K Reveals Bull Trap, Will BTC Price Drop To $65K? appeared first on Coinpedia Fintech News
Following the massive overnight recovery of 7.73%, Bitcoin price reveals exhaustion in buyers to sustain the trend. The BTC price took a 1.7% dip last night and is starting the Asian trading hours on a bearish tone.
Trading under the $70K levels, the buyers are taking the heat from overhead supply as the bull trap reveals itself. Will the short-correction start a bearish avalanche to slide the BTC price under the $65K mark? Or is it just a retest before a massive surge to a new all-time high?
Let’s look at our detailed price analysis for a clearer view of the BTC price trend. Further, you can check out our Bitcoin price prediction to find out the chances of Bitcoin hitting the $100,000 milestone this year.
BTC Price Performance
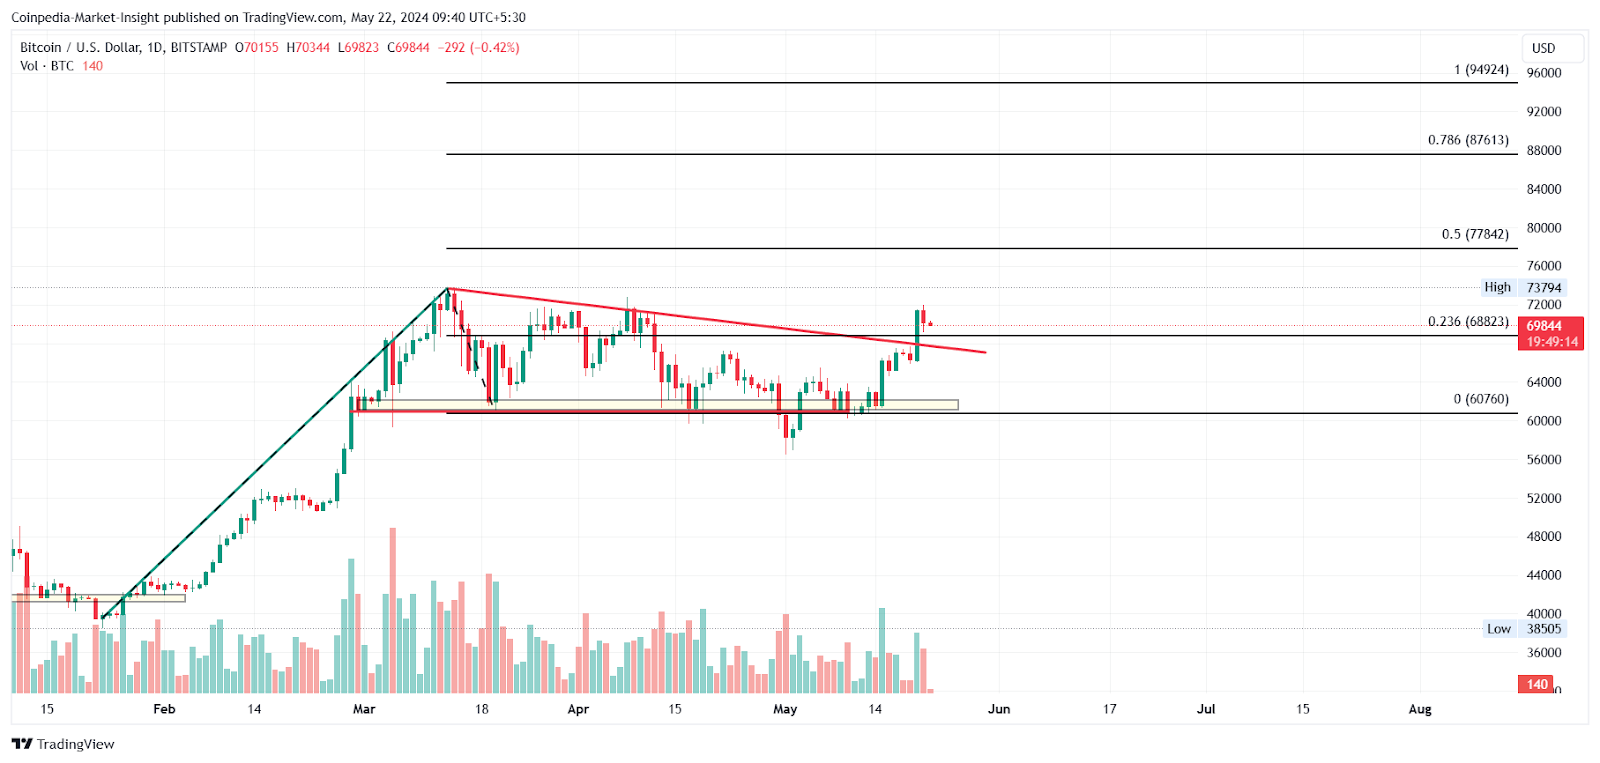
Almost reaching an all-time high, the BTC price fails to sustain the rally above $71K, resulting in a turnaround within 24 hours. Bitcoin takes a dip of 1.77% and retests the 23.60% Fibonacci level at $68,823 with a lower price rejection.

The lower price rejection bolsters the bullish point of view, and the post-retest reversal to continue the prevailing trend. Further, the bullish breakout of the flag pattern teases a jump beyond the all-time high at $73,794.
However, on closer inspection, the $71,400 level is now rejecting the bullish attempt for the third time. Hence, a high supply zone is visible and warns of a bearish turnaround.
Currently, the BTC price trades at $69,758 with an intraday drop of 0.54%. This reflects a bearish continuation and pressures the $68,823 support.
Bitcoin ETFs Mark 7D Positive Streak
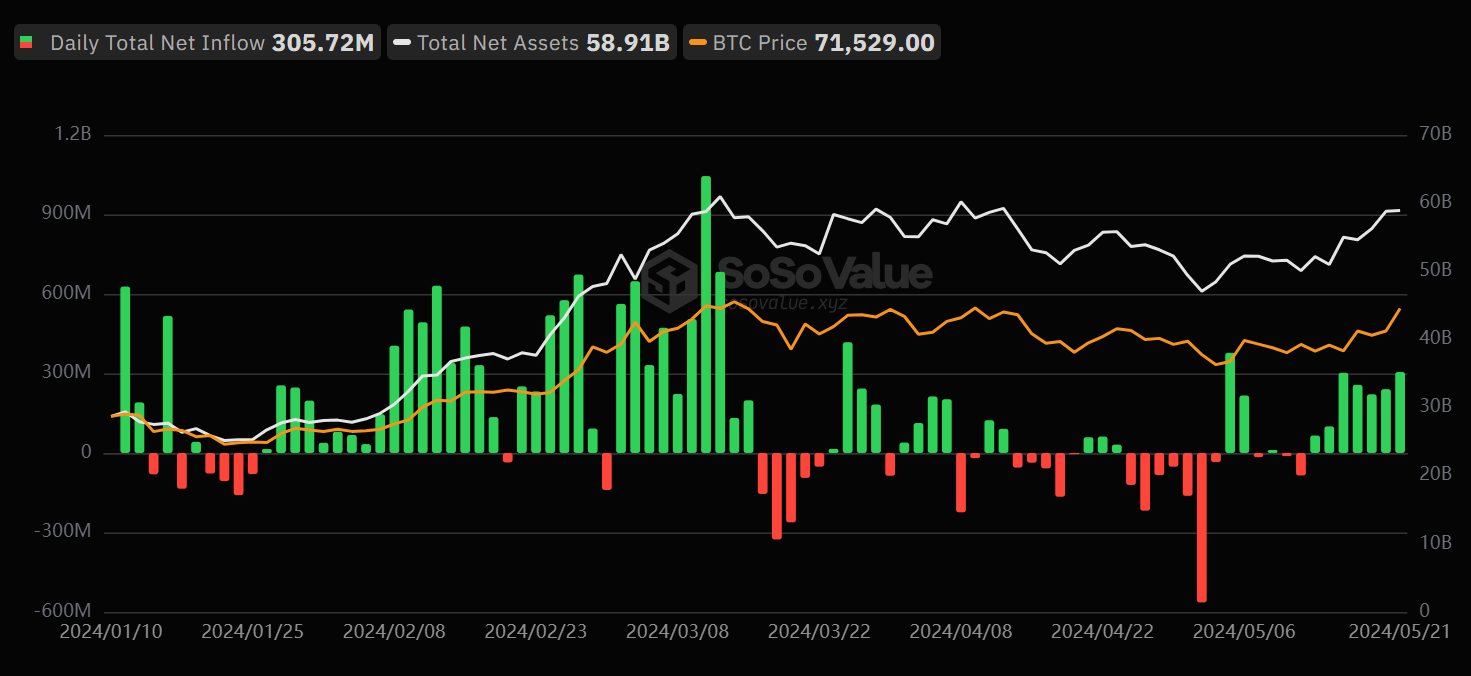
On May 21, Bitcoin spot ETFs saw a significant inflow of $306 million, continuing a trend of seven consecutive days of net inflow. Grayscale’s GBTC had no net outflow for the day, while BlackRock’s IBIT saw a substantial single-day inflow of $290 million.

Overall, the total net asset value of Bitcoin spot ETFs reached $58.910 billion. This consistent inflow indicates strong investor confidence and interest in Bitcoin through these ETFs.
Bullish Funding Rates Ignore The Trap
Over the last 7 days, the Open Interest of Bitcoin has surged by 15.5% to reach $16.76 billion, indicating increased market liquidity and volatility. On the other side, the funding rate at 0.00803132 signifies that the long traders are dominant, supporting the bullish viewpoint. Hence, the derivatives data suggest an overall stronger bullish side for the BTC price trend.
On-Chain Reveals Investors’ Confidence
Bitcoin’s transfer volume has increased by 106.44% to hit 924,412.09 over the past 7 days, reflecting a boom in transaction activity. In support, the Binary CDD value of 0.28571428 indicates that long-term holders refuse to book profits, reflecting a strong underlying confidence in Bitcoin. Thus, the data supports a bullish outlook, with a potential BTC price surge coming soon.
Will The BTC Price Sustain Above $68K?
Despite the bullish reversal from the $71K levels and the breakdown of $70K, the overall sentiment for Bitcoin remains bullish. As the talks of the Ethereum ETF fill up the market, the BTC price is expected to continue the uptrend, with growing attention on the crypto world.
Moreover, the retest story might soon play out to prolong the upside rally in Bitcoin and break past the $74K mark. In such a case, the next stop this month could be $79K.
However, a reversal crashing under the $68K level might retest the $65K zone.
.png)
 8 months ago
3


 English (US)