ARTICLE AD BOX
Bitcoin Cash (BCH) price is experiencing an interesting phase, with strong market interest despite a contrasting signal.
With BCH finding support at $617, the cryptocurrency faces a pivotal resistance that could lead to significant price movements. This scenario presents a complex yet potentially bullish picture for Bitcoin Cash.
Bitcoin Cash Shows Strong Interest
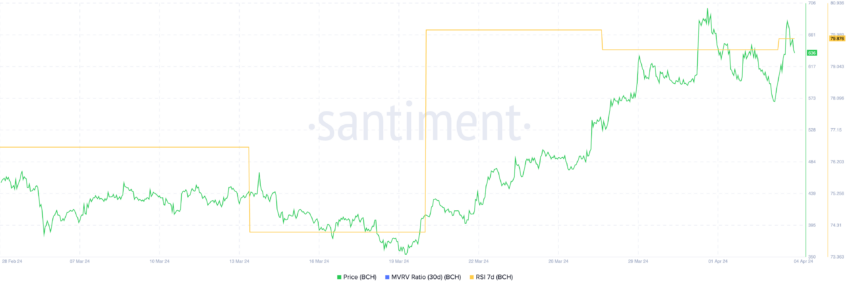
The current Relative Strength Index (RSI) of BCH at 79 matches the levels seen during its March rally, suggesting significant momentum. The RSI is an oscillator that measures the speed and change of price movements, with values above 70 typically indicating an asset is overbought and below 30 suggesting it is oversold.
Despite the overbought implication, a high RSI for Bitcoin Cash does not necessarily predict a downturn; rather, it highlights strong investor interest and ongoing buying activity. This could signal continued price growth, supported by a market eager to invest in BCH at or above current prices.
 Bitcoin Cash RSI. Source: Santiment
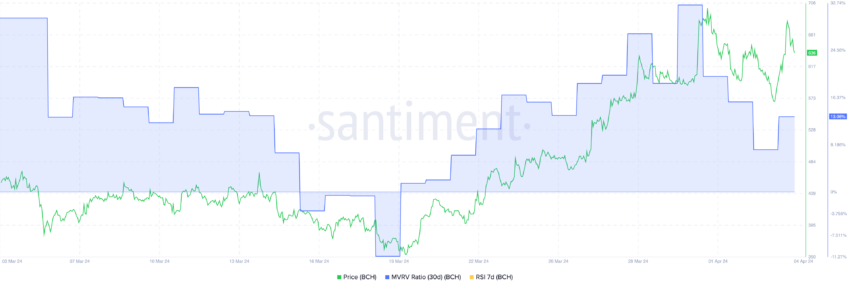
The 30-day Market Value to Realized Value (MVRV) ratio for Bitcoin Cash is 13%, which some analysts might view as bearish.
Despite the drop to 13%, it is noteworthy that BCH has achieved price gains with similar MVRV ratios in the past. This suggests a potential for continued investment and price increases, reinforcing a generally bullish outlook for the cryptocurrency.
 Bitcoin Cash MVRV. Source: Santiment
The MVRV ratio compares the market cap with the realized cap to assess if an asset is undervalued or overvalued. While there’s no universally perfect MVRV ratio, extreme values can indicate potential market corrections.
BCH Price Prediction: $733 Within Reach
With solid support at $617 and the next major resistance at $673, breaking through this barrier could set BCH on a path to $733, revisiting its highest valuation since May 2021.
Read More: Bitcoin Cash (BCH) Price Prediction 2024/2025/2030
 Bitcoin Cash IOMAP. Source: IntoTheBlock
The In/Out of the Money Around Price (IOMAP) chart is a valuable tool in this analysis, indicating significant price levels based on historical buying and selling activity.
These insights highlight key support and resistance levels determined by investor positions, with a breakdown possibly leading to a fallback to $577 for Bitcoin Cash.
The post Bitcoin Cash (BCH) Price Targets a 3-Year High appeared first on BeInCrypto.
.png)
 7 months ago
13


 English (US)