ARTICLE AD BOX

The post Bitcoin Exceeds $61,000 With Rate Cuts Hype Fueling Bullish Engines appeared first on Coinpedia Fintech News
Recovering from a minor slump below the $60,000 critical mark, Bitcoin is back with the hype of rate cuts resurfacing. Concluding the bearish sprint and extending the prevailing uptrend, the BTC price exceeds the $61,000 level as the bullish engines heat up.
So, are you considering buying Bitcoin as the bulls resurface? More importantly, will this BTC price rally create a new all-time high?
Bitcoin Price Performance
In the last 24 hours, Bitcoin’s price has increased by 4.64%, with an intraday growth of 2.84%. Over the past two daily candles, Bitcoin has jumped 4.70%, surpassing the $61,000 resistance level. Currently trading at $61,184, Bitcoin is projecting a bullish recovery.
 BTC USD analysis
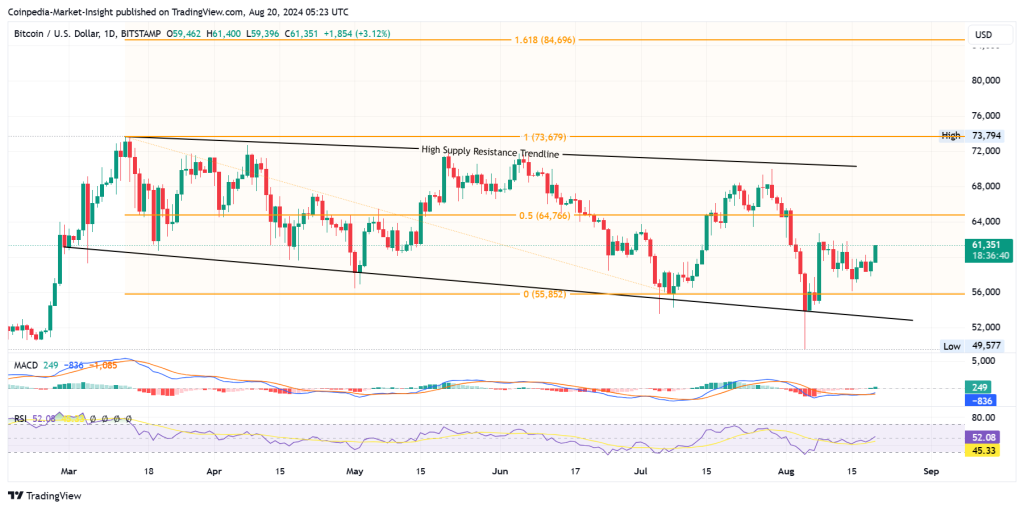
On a broader scale, the BTC price action reveals a bullish cycle, gaining momentum within a falling channel. Considering the prevailing uptrend, this falling channel also forms a bullish flag pattern.
Bitcoin has formed a rounding bottom reversal in the short term, with the neckline at $61,625. A breakout above this level could extend the BTC price rally further.
The MACD indicator shows a bullish crossover between the MACD and signal line, with positive histograms resurfacing. The daily RSI line has also shown an uptick, surpassing the 50% mark. These momentum indicators are positive, reinforcing the bullish sentiment.
Weak Bullish Hands Get Shaken Out
With $43M worth of short positions liquidating in 12 hours, the crypto market witnessed a boost in its recovery run.
Further, Bitcoin’s dominance increased by 0.50% to 56.07%, and the BTC price jump improved the market sentiment. The crypto Fear and Greed Index shows that the mood has uplifted, as the index is up 7.14%.
Will BTC Price Hit $50K?
The next resistance level for the BTC price is the 50% Fibonacci retracement level at $64,766. As the bull cycle in Bitcoin, starting from the $55,852 support level, has picked up pace; the rally will likely challenge the overhead resistance trendline.
A bullish breakout above this trendline could be a significant buy signal for traders, marking the flag pattern breakout. With this, Bitcoin could surpass $73,679, setting a new all-time high and potentially targeting $84,696, the 1.618% Fibonacci level.
.png)
 3 months ago
14


 English (US)