.png)
 15 hours ago
2
15 hours ago
2
ARTICLE AD BOX
Bitcoin price started a fresh decline from the $90,000 zone. BTC is back below $82,500 and might continue to move down below $78,000.
- Bitcoin started a fresh decline below the $82,000 zone.
- The price is trading below $80,000 and the 100 hourly Simple moving average.
- There is a key bearish trend line forming with resistance at $82,200 on the hourly chart of the BTC/USD pair (data feed from Kraken).
- The pair could start another decline if it fails to clear the $82,000 resistance zone.
Bitcoin Price Faces Hurdles
Bitcoin price started a fresh decline below the $85,000 level. BTC traded below the $83,000 and $80,000 support levels. Finally, the price tested the $76,500 support zone.
A low was formed at $76,818 and the price recently started a consolidation phase. There was a move above the $78,000 and $78,500 resistance levels. The bulls pushed the price toward the 23.6% Fib retracement level of the downward move from the $91,060 swing high to the $76,818 low.
Bitcoin price is now trading below $80,000 and the 100 hourly Simple moving average. On the upside, immediate resistance is near the $80,200 level. The first key resistance is near the $82,000 level.
There is also a key bearish trend line forming with resistance at $82,200 on the hourly chart of the BTC/USD pair. The next key resistance could be $84,000. It is near the 50% Fib retracement level of the downward move from the $91,060 swing high to the $76,818 low.
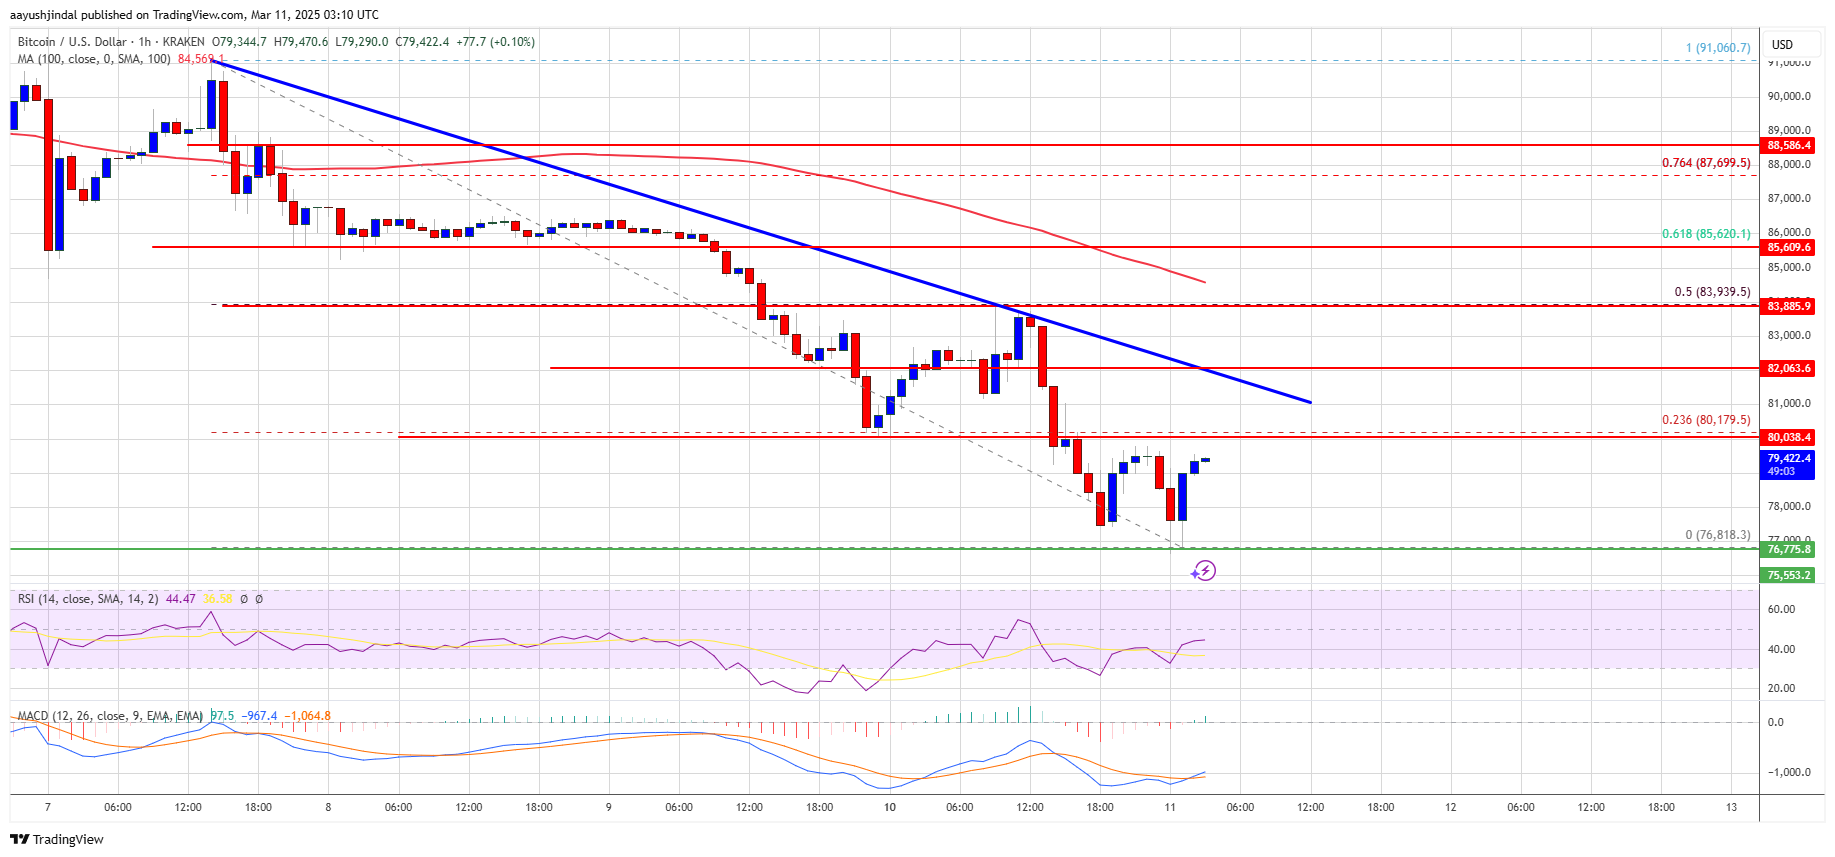
A close above the $84,000 resistance might send the price further higher. In the stated case, the price could rise and test the $85,500 resistance level. Any more gains might send the price toward the $88,000 level or even $96,200.
Another Drop In BTC?
If Bitcoin fails to rise above the $82,000 resistance zone, it could start a fresh decline. Immediate support on the downside is near the $77,200 level. The first major support is near the $76,500 level.
The next support is now near the $75,000 zone. Any more losses might send the price toward the $72,000 support in the near term. The main support sits at $70,000.
Technical indicators:
Hourly MACD – The MACD is now losing pace in the bearish zone.
Hourly RSI (Relative Strength Index) – The RSI for BTC/USD is now below the 50 level.
Major Support Levels – $76,500, followed by $75,000.
Major Resistance Levels – $80,000 and $82,000.


 English (US)