ARTICLE AD BOX
The post Bitcoin Under $62K Warns A 10% Crash Next Week? appeared first on Coinpedia Fintech News
With almost $90 million in long liquidations, the Bitcoin price is evidently under high bearish pressure, dropping by 4.44% in 72 hours. Further, this drop showcases an amplified bearish wave transcending to the altcoins sector.
With almost a 15% drop in April 2024, the BTC price marks the first bearish month after August 2023. The price drop in the highly anticipated month of Bitcoin Halving expresses a healthy correction for a prolonged uptrend to an optimistic eye.
Will this pullback and the rising volatility around the $60,000-$62,000 support zone end the uptrend for Bitcoin? Or is the Bitcoin price prediction of reaching the $100,000 milestone come true?
BTC Price Performance
The biggest cryptocurrency with a market cap of $1.213 Trillion, Bitcoin trades at $61,516 and a 6.63% 7D return. With a massive market cap, Bitcoin dominates 53.50% of the crypto market. Hence, any move in the BTC price trend leads to an amplified move in the altcoins sector.

During April’s downfall, the BTC price trend shows an intense pullback, breaking under the support trendline. The short-term bullish reversal last weekend led to the retest.
With a post-retest reversal, Bitcoin price is starting another dip and tests the bullish dominance at the $62,000 demand zone. Currently, the BTC price trades at $61,482 with an intraday move of 0.49%.
While the reversal shows an increase in supply, the daily RSI line reflects a potential bullish comeback around the corner. After a reversal from the oversold boundary, the RSI line trends close to the halfway line.
Bitcoin ETFs Slowdown Drys BTC Uptrend
On May 8, 2024, the Bitcoin ETFs witnessed a minor net inflow of $11.5M, dominated solely by the Bitwise ETF ($BITB). Despite this, the overall activity within the 10 major US Bitcoin ETFs, including Grayscale ($GBTC), remained largely stagnant, indicating a pause in momentum.
Surprisingly, Funding Rates Are Bullish
The Bitcoin derivatives market currently exhibits a bullish sentiment, underscored by a funding rate of 0.0032813, where long position holders are the majority. This is complemented by a taker buy/sell ratio favoring buyers (0.52036968), suggesting strong buying pressure that could drive prices upwards.
Open interest in the market has increased by 3.78% over the last week to $14.48 billion, indicating growing liquidity and volatility. However, the higher rate of long liquidations, amounting to $21.31 million, indicates potential over-optimism among traders. Thus, it highlights a cautiously optimistic market but not without risks.
80% of Bitcoin HODLers Are Waiting For Profits
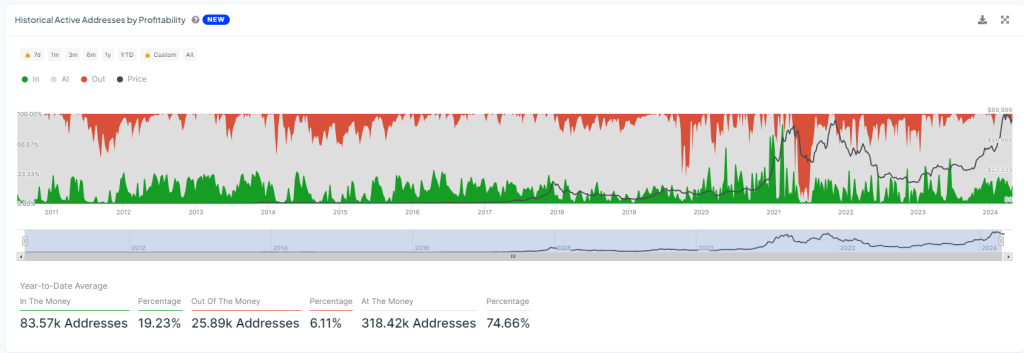
Bitcoin’s historical active addresses analysis by profitability reveals a vast financial gap among holders. Only about 20% of addresses, totalling 83.57k, are “In The Money.” This suggests a relatively small segment is making money at the current market price.

Conversely, the rest of the majority, almost 80% of HODLers, are still waiting for profits. Specifically, 6.11% of addresses, or 25.89k, are “Out Of The Money,” and 74.66% of addresses, which translates to 318.42k, are “At The Money.”
Conclusion
The overall volatility in the market is rising, with Bitcoin struggling near the $60,000 support zone. With the ongoing pullback, the downside risk is high, with support levels of $60,000 and $57,000 under threat.
However, a bullish survival above $60,000 could prolong the prevailing uptrend and surpass the $65,000 mark.
.png)
 8 months ago
1


 English (US)