ARTICLE AD BOX

- Bitcoin hits ATH of $69,170, then dips to a 6-day low of $59K.
- BlackRock’s Bitcoin ETF sets a $3.7B volume record amid volatility.
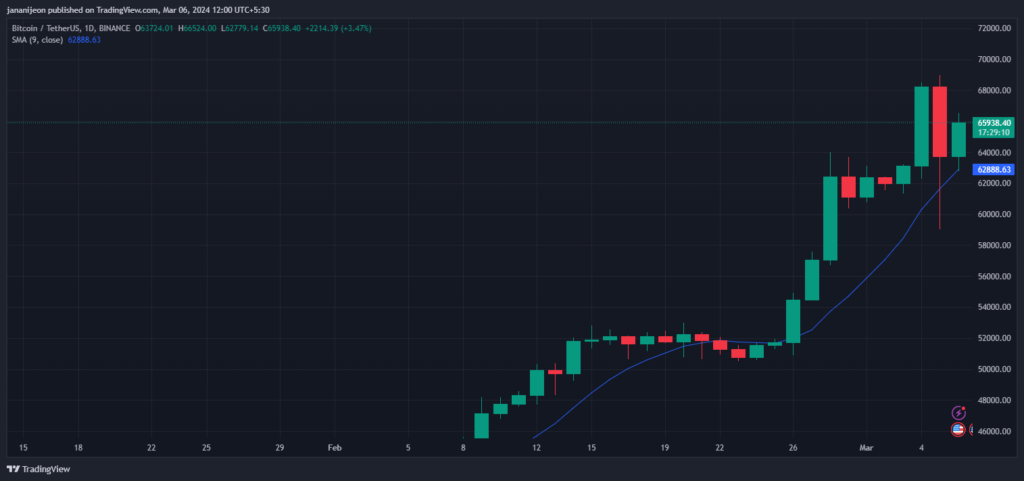
Bitcoin, the leading cryptocurrency by market cap, surged to a new all-time high of $69,170, marking its first record peak in over two years. The jubilation was short-lived, as BTC experienced a sharp decline, dropping to a 6-day low of $59,323. This volatility led to a 7% decrease in the overall market capitalization, underscoring the unpredictable nature.
Bitcoin’s rollercoaster ride reflects the complex interplay of factors driving its value. Notably, inflows into US-spot Bitcoin exchange-traded funds (ETFs), speculation in derivatives markets, and a potential decrease in the supply growth of the token have all contributed to this year’s significant rally. Yet, this surge has also stretched investor positions thin, sparking fears of a potential market pullback.
Adding to the tumult, a Bitcoin “whale” — a term for investors holding large amounts of cryptocurrency — reemerged after 14 years, transferring 1,000 BTC (worth approximately $67.1 million) to the Coinbase exchange. These coins, minted in 2010 when Bitcoin’s value was below $0.28, netted an estimated profit of over $60 million. This move is speculated to be a catalyst for the market’s sudden downturn.
Meanwhile, in the same time duration, BlackRock’s iShares Bitcoin Trust ETF shattered its daily trading volume record, reaching $3.7 billion as Bitcoin hit its peak. This surge in trading volume, a clear indicator of the growing mainstream interest in cryptocurrency, exceeded the previous record by $400 million.
Bitcoin Bulls Will Recover?
Currently, Bitcoin is trading at $66,115.65, representing a decrease of 1.16%. The trading volume stands at $99 billion, marking a 31% increase. Amidst these developments, analyses of Bitcoin’s price movements paint a bullish picture. The daily chart shows a bullish trend, with the 9-day Simple Moving Average (SMA) positioned below the trading price at $62,919. However, the daily Relative Strength Index (RSI) suggests an overbought condition, standing at 72.
 BTC Price Chart, Source: TradingView
If the bulls take over, BTC might again create a new all-time high (ATH), surging above $69,300. Conversely, if the bears take over, it might drop to $60,735 and $59,627.
.png)
 9 months ago
3


 English (US)