ARTICLE AD BOX
The Ripple XRP price fell last week but still trades above a pivotal horizontal support area.
The price action since October has been neutral. Will XRP initiate a bounce at the current support area to close the year strong?
Ripple Trades Above Support
The technical analysis from the weekly time frame shows that the XRP price has traded above an ascending support trend line since May 2022.
More recently, the price bounced above this trend line in April, accelerating its rate of increase. This led to a new yearly high of $0.94 in July 2023.
However, the XRP price has fallen since (red icon), creating a long upper wick and validating a long-term horizontal resistance area.
Despite the decrease, XRP regained its footing in October and trades above a long-term horizontal support area.
 XRP/USDT Weekly Chart. Source: TradingView
Market traders use the RSI as a momentum indicator to identify overbought or oversold conditions and to decide whether to accumulate or sell an asset.
Readings above 50 and an upward trend indicate that bulls still have an advantage, whereas readings below 50 suggest the opposite.
The weekly RSI is above 50 and increasing, both signs of a bullish trend.
What Are Analysts Saying?
Cryptocurrency traders and analysts on X give mixed readings for the future trend.
MisterChoc is not enthusiastic about the future prospects because the price is at a similar level to what it was in 2018 and 2020.
Louie is bullish since he believes the XRP price will break out from a long-term symmetrical triangle pattern.
 XRP/USDT Weekly Chart. Source: X
ChloeXRP is also bullish, with targets well above $1. She tweeted:
I’ve updated my “𝐓𝐚𝐤𝐞 𝐩𝐫𝐨𝐟𝐢𝐭𝐬” at the following price levels – $1.81 – $2.96 – $5.50 Most of my $XRP positions will take profit around the $5 mark. I then plan to buy back at lower prices / once a pull back happens.
Finally, egragcrypto believes that the XRP price will increase rapidly and move to $5.50.
Read more: (XRP) Ripple Price Predictions
XRP Price Prediction: Can Price End the Year Bullishly?
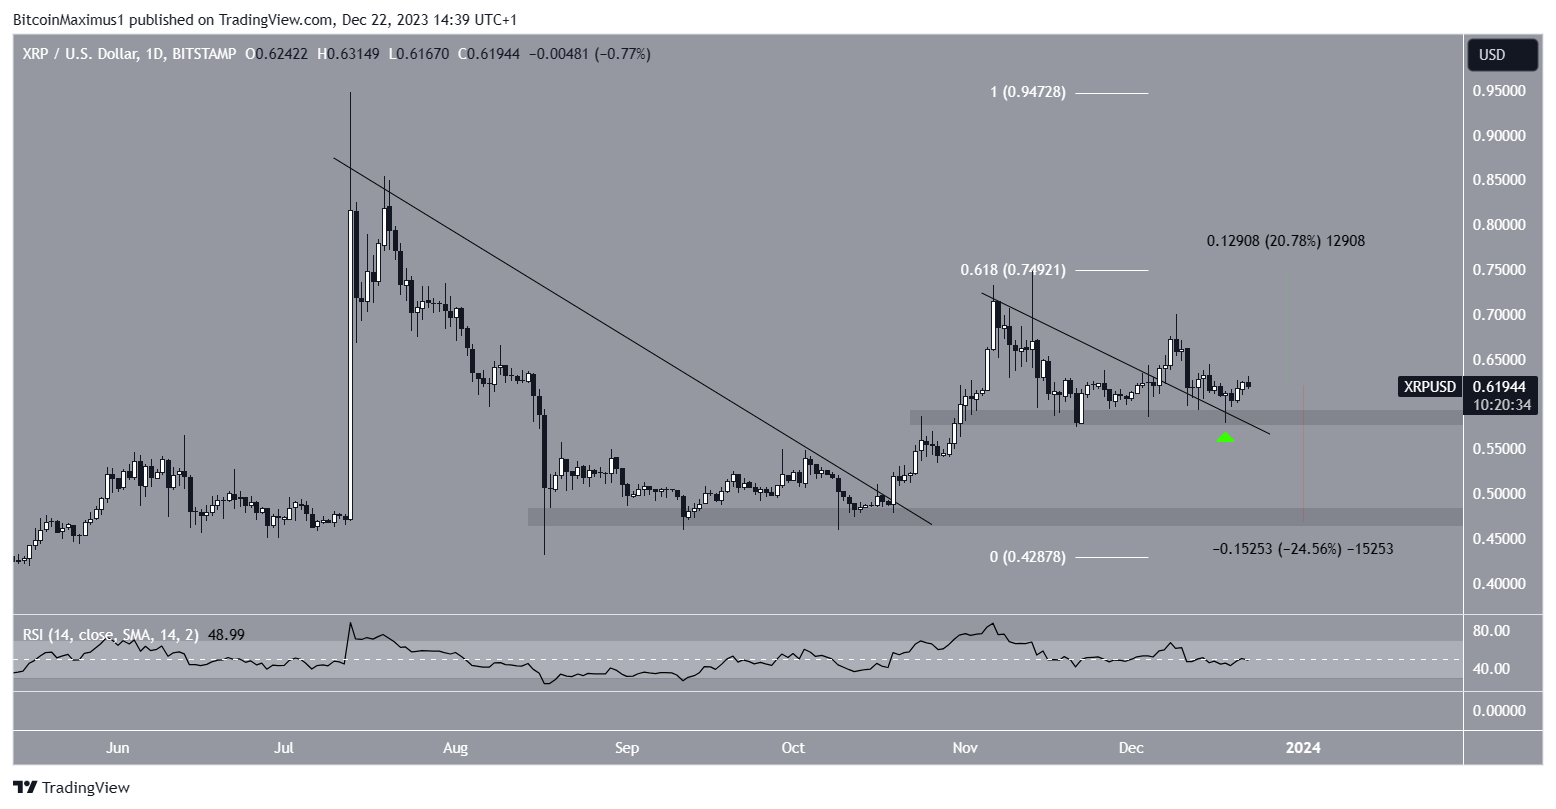
The daily time frame technical analysis is leaning slightly bullish. The price has broken out from a long-term descending resistance trend line in October and from a short-term trend line in December.
On December 18, the XRP price bounced above this trend line, creating a long lower wick (green icon). This is a common retest after the price breaks out above resistance.
However, the daily RSI does not confirm this breakout since the indicator is still at 50. In any case, the price action can be considered bullish since XRP also trades above the minor $0.60 horizontal area.
If the breakout continues, the XRP price can increase by 20% to the 0.618 Fib retracement resistance level at $0.75.
 XRP/USD Daily Chart. Source: TradingView
Despite this bullish XRP price prediction, closing below the $0.60 area will negate the breakout. The altcoin could then fall by 25% to the next closest support at $0.47.
For BeInCrypto’s latest crypto market analysis, click here.
Best crypto platforms in Europe | December 2023
The post Can Ripple (XRP) End the Year on a High? Analysts Unsure About the Future Trend appeared first on BeInCrypto.
.png)
 1 year ago
8


 English (US)