ARTICLE AD BOX
In our previous analysis, Chainlink (LINK) was trading at $16, and BeInCrypto forecasted a substantial price decline, which has since been validated.
This analysis updates the previous one, offering traders and investors data-driven insights on effectively navigating the market.
Chainlink Support Level Key Area to Watch
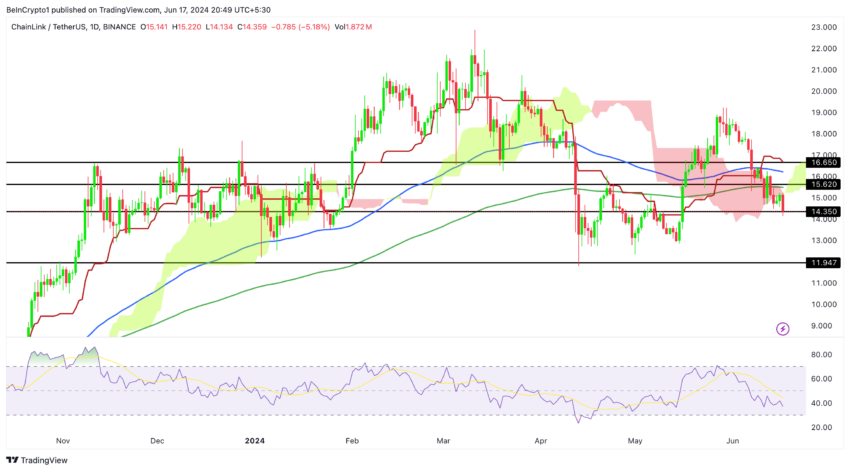
In the previous analysis published on June 10, 2024, LINK was trading at $16. At that time, BeInCrypto predicted a significant price drop, which has since been confirmed. Chainlink breached a crucial support level at $15.6, continuing its decline to reach the critical support level of $14.30.
 Chainlink Price Analysis (Daily). Source: TradingView
LINK’s price has dropped below both the 100 EMA and 200 EMA on the daily chart, which is a strong bearish signal. The price is finding resistance at these EMA levels, reinforcing the downward trend. Furthermore, the price has penetrated the Ichimoku Cloud to the downside, indicating increased downward volatility.
Read More: How To Buy Chainlink (LINK) and Everything You Need To Know
Key support levels to watch are $14.30 and $11.95, the latter being the next major support if $14.30 is breached. Resistance levels are noted around $15.60, $16.00, and $16.65, with significant resistance at the 100 and 200 EMA levels. The RSI has dropped further, from 43 to around 38, indicating sustained bearish momentum.
The breakout of $14.30, a critical support level identified in the previous analysis, confirms the bearish outlook. Continued monitoring of this support is crucial, as failure to hold it could lead to a further decline towards $11.95.
The Number of Addresses Holding Unrealized Losses Is Growing Swiftly
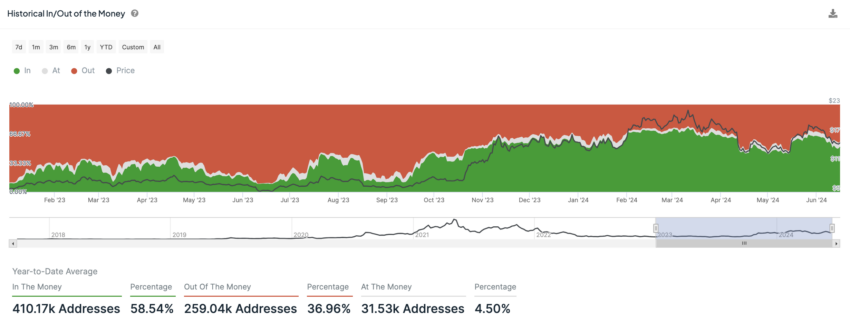
In June 2024, Chainlink (LINK) saw an important rise in the number of addresses holding LINK on the Ethereum blockchain that were facing unrealized losses. The percentage of such addresses jumped from 31.43% to 43.15%. Indicating a bearish trend and a growing trend of cutting losses.
This increase in underwater holdings reflects a negative sentiment among LINK holders, with nearly half now experiencing unrealized losses. The largest daily increase in these addresses occurred on June 11.
Read More: Chainlink (LINK) Breaks Below Key Support, Signaling Potential Downtrend
 Chainlink’s Historical In/Out of The Money (Ethereum). Source: IntoTheBlock
At the same time, the proportion of addresses at the break-even point remained stable, starting at 5.07% and ending at 5.81%. This stability suggests few fluctuations in addresses that are neither profit nor loss, indicating a balanced market condition. The biggest daily increase in break-even addresses was on June 10, indicating a period when more addresses found themselves at the break-even point.
Conversely, the proportion of addresses in profit decreased from 63.50% to 51.03%, highlighting a significant drop in profitability. The largest daily decrease in addresses with unrealized profits was also on June 11. Correlating this to the increase in addresses facing losses suggests improving market conditions.
The current outlook for LINK remains bearish. A shift to a bullish trend could occur if the price successfully re-enters the daily Ichimoku Cloud and breaks above the EMAs depicted in the initial chart. However, LINK’s fundamentals are bearish, with over 40% of holders currently experiencing losses.
This could prompt some to sell their holdings, potentially exerting downward pressure on the price. If Bitcoin declines below $65,000, LINK may test a critical support level at $11.90.
The post Chainlink (LINK) Price Faces Critical Test at Key Support appeared first on BeInCrypto.
.png)
 4 months ago
6


 English (US)