ARTICLE AD BOX
The Ethereum (ETH) price increased above $3,500 on February 29 but has fallen slightly since.
Ethereum increased above a confluence of short- and long-term resistance levels during the upward movement.
Ethereum Reaches $3,500
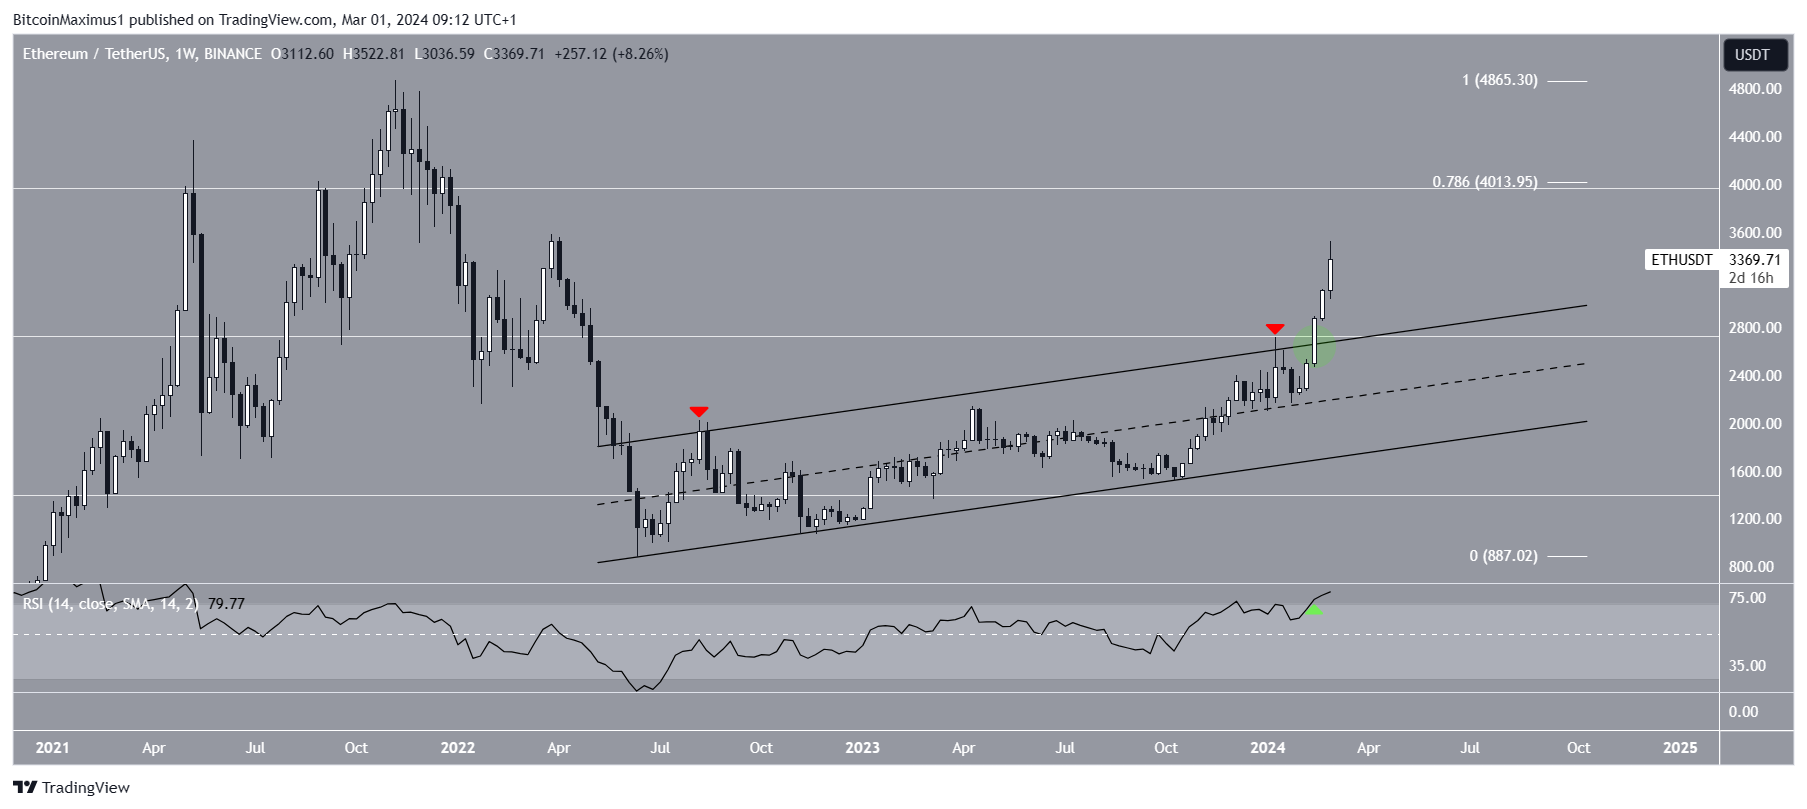
The weekly time frame technical analysis shows the ETH price has been trading inside a long-term ascending parallel channel since June 2022. The price made two unsuccessful breakout attempts (red icons).
ETH finally broke out in February 2024. The breakout (green circle) also took it above the middle of a long-term range between $1,400 – $4,000 (white).
Yesterday, ETH reached a high of $3,522, the highest price since March 2022.
 ETH/USDT Weekly Chart. Source: TradingView
The weekly Relative Strength Index (RSI) gives a bullish reading. Traders utilize the RSI as a momentum indicator to assess whether a market is overbought or oversold and whether to accumulate or sell an asset.
If the RSI reading is above 50 and the trend is upward, bulls still have an advantage, but if the reading is below 50, the opposite is true. The indicator is above 70 (green icon) and increasing, both signs of a bullish trend.
Read More: What Is Wrapped Ethereum (WETH)?
What Are Analysts Saying?
Some cryptocurrency traders and analysts on X posit that this is just the beginning of a larger Ethereum trend.
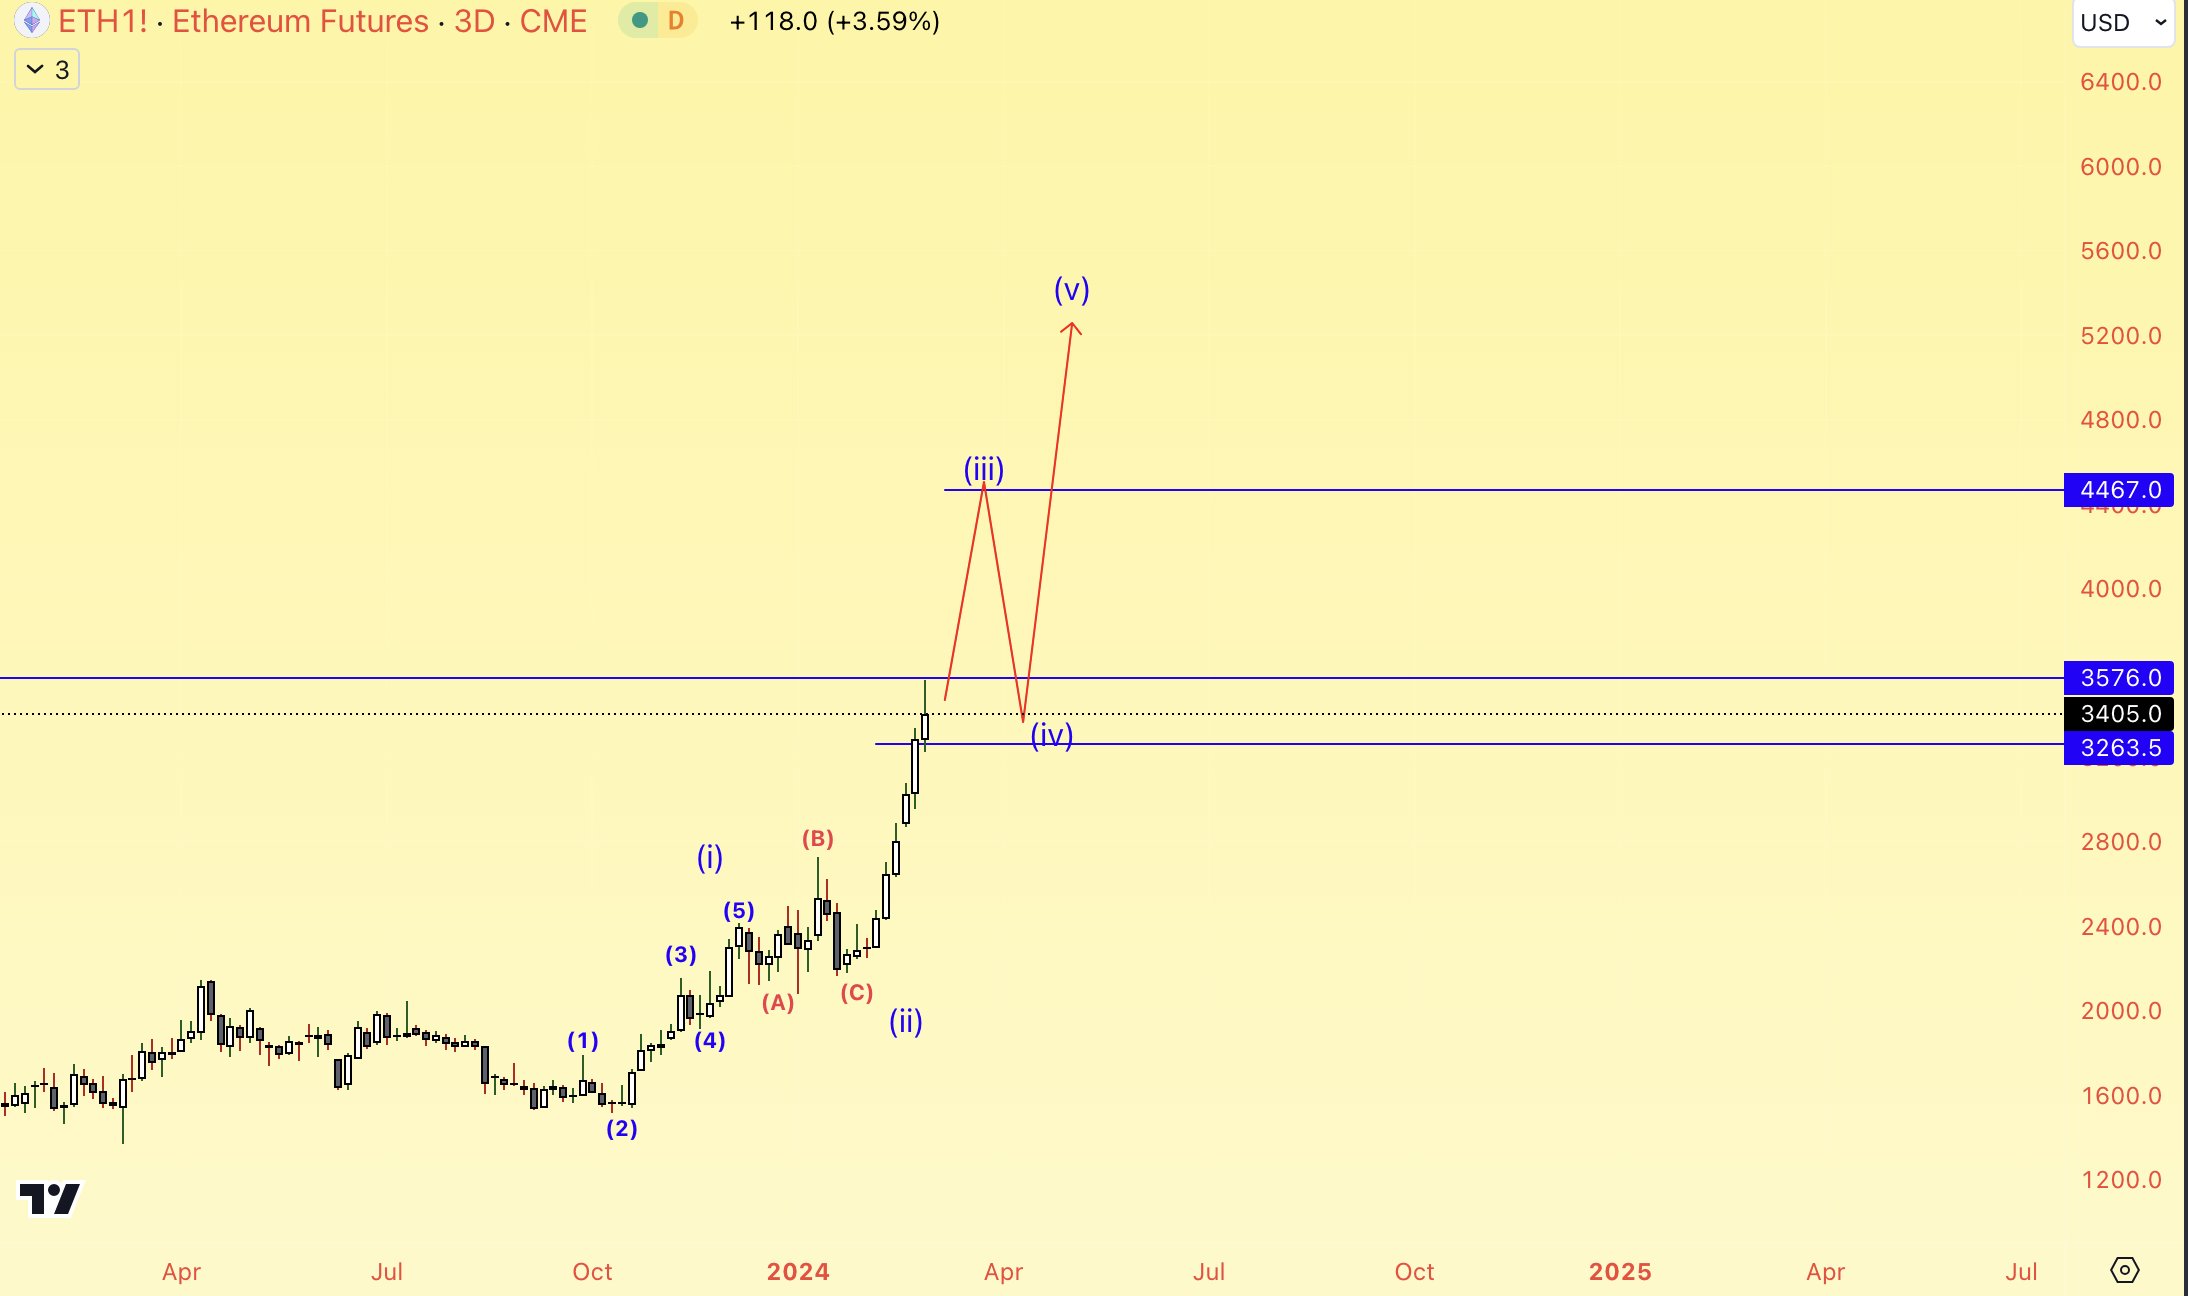
Altstreetbets used an Elliott Wave count to predict the ETH price will increase to $5,500.
 ETH/USDT 3-Day Chart. Source: X
InmortalCrypto believes ETH will increase to $10,000, while IncomeSharks noted his target of $3,500 has been reached.
Byzantine General outlined his reasons for the bullish ETH prediction.
“But everyone is already overweight ETH, it can’t pump anymore.” No lil bro. Only a small terminally ill section of this niche community on just twitter is overweight ETH. That is, in the grand scheme of things, nothing,” he stated.
Read More: What is Ethereum Restaking?
ETH Price Prediction: Is $4,000 Next?
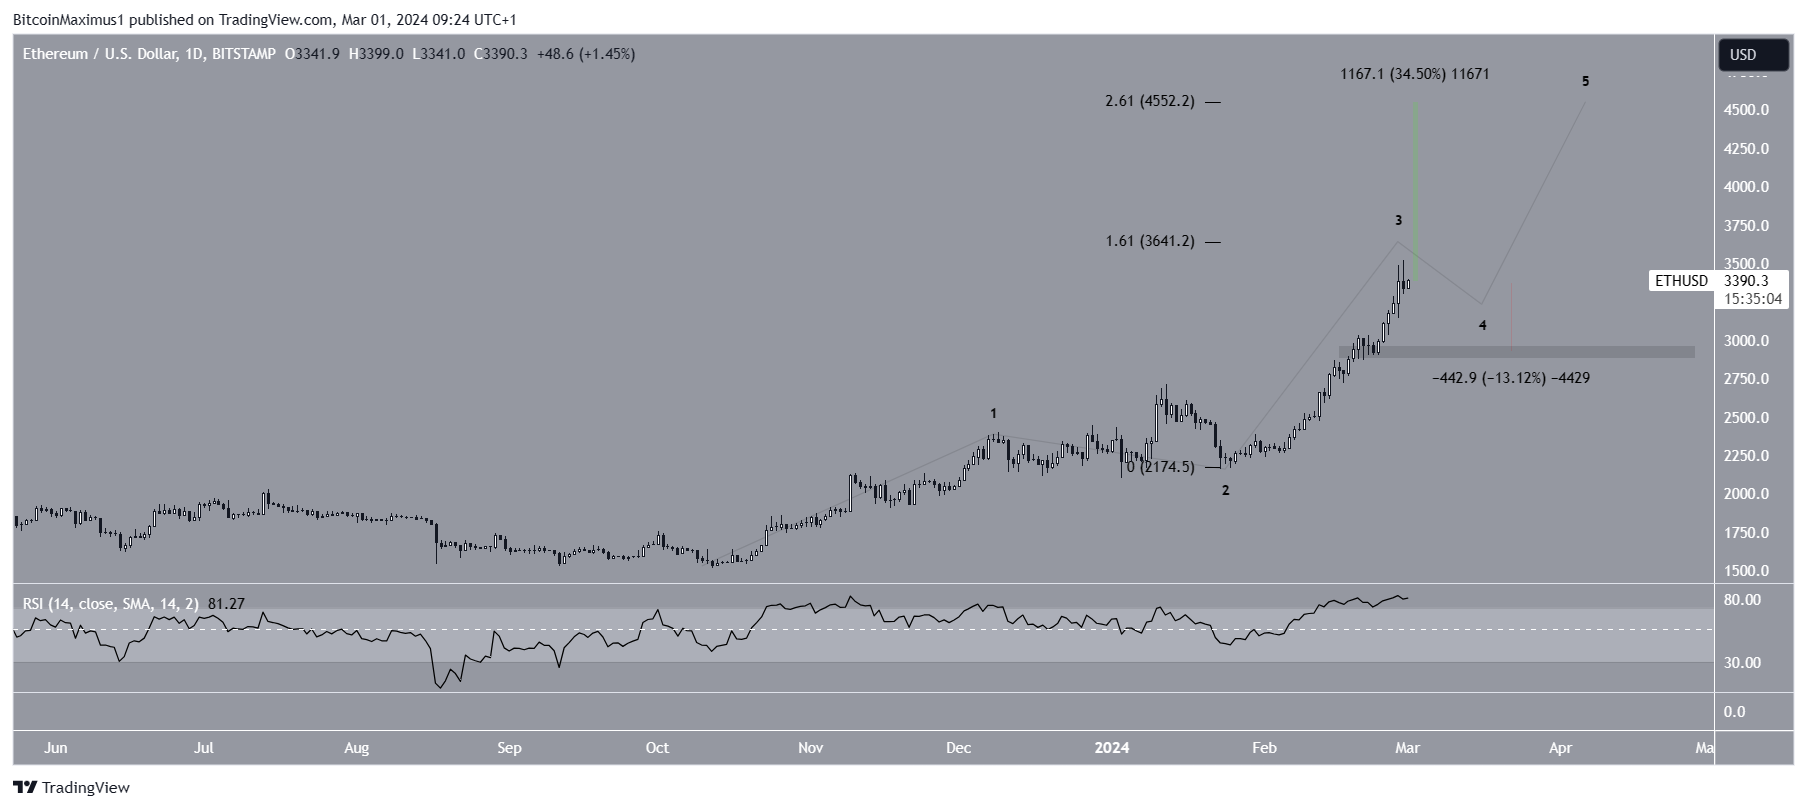
The technical analysis of the daily time frame supports the upward movement because of the wave count and RSI. Technical analysts utilize the Elliott Wave theory to ascertain the trend’s direction by studying recurring long-term price patterns and investor psychology.
The most likely wave count suggests that ETH is in wave three of a five-wave upward movement (black). So far, wave three has had 1.61 times the length of wave one. This is a potential level for a top.
However, the daily RSI does not show any weakness since the indicator is still increasing.
So, if ETH breaks out from the $3,640 resistance, it can increase by another 35% to the next resistance at $4,550, giving waves one and three a 1:2.61 ratio.
 ETH/USDT Daily Chart. Source: TradingView
Despite this bullish ETH price prediction, failure to break out from $3,640 can trigger a 13% drop to the closest support at $3,000. This would complete wave four.
Read More: What Is the Ethereum Dencun Upgrade?
For BeInCrypto‘s latest crypto market analysis, click here.
The post Ethereum (ETH) Price Touches $3,500 High — Is $4,000 on the Horizon? appeared first on BeInCrypto.
.png)
 8 months ago
23


 English (US)