ARTICLE AD BOX
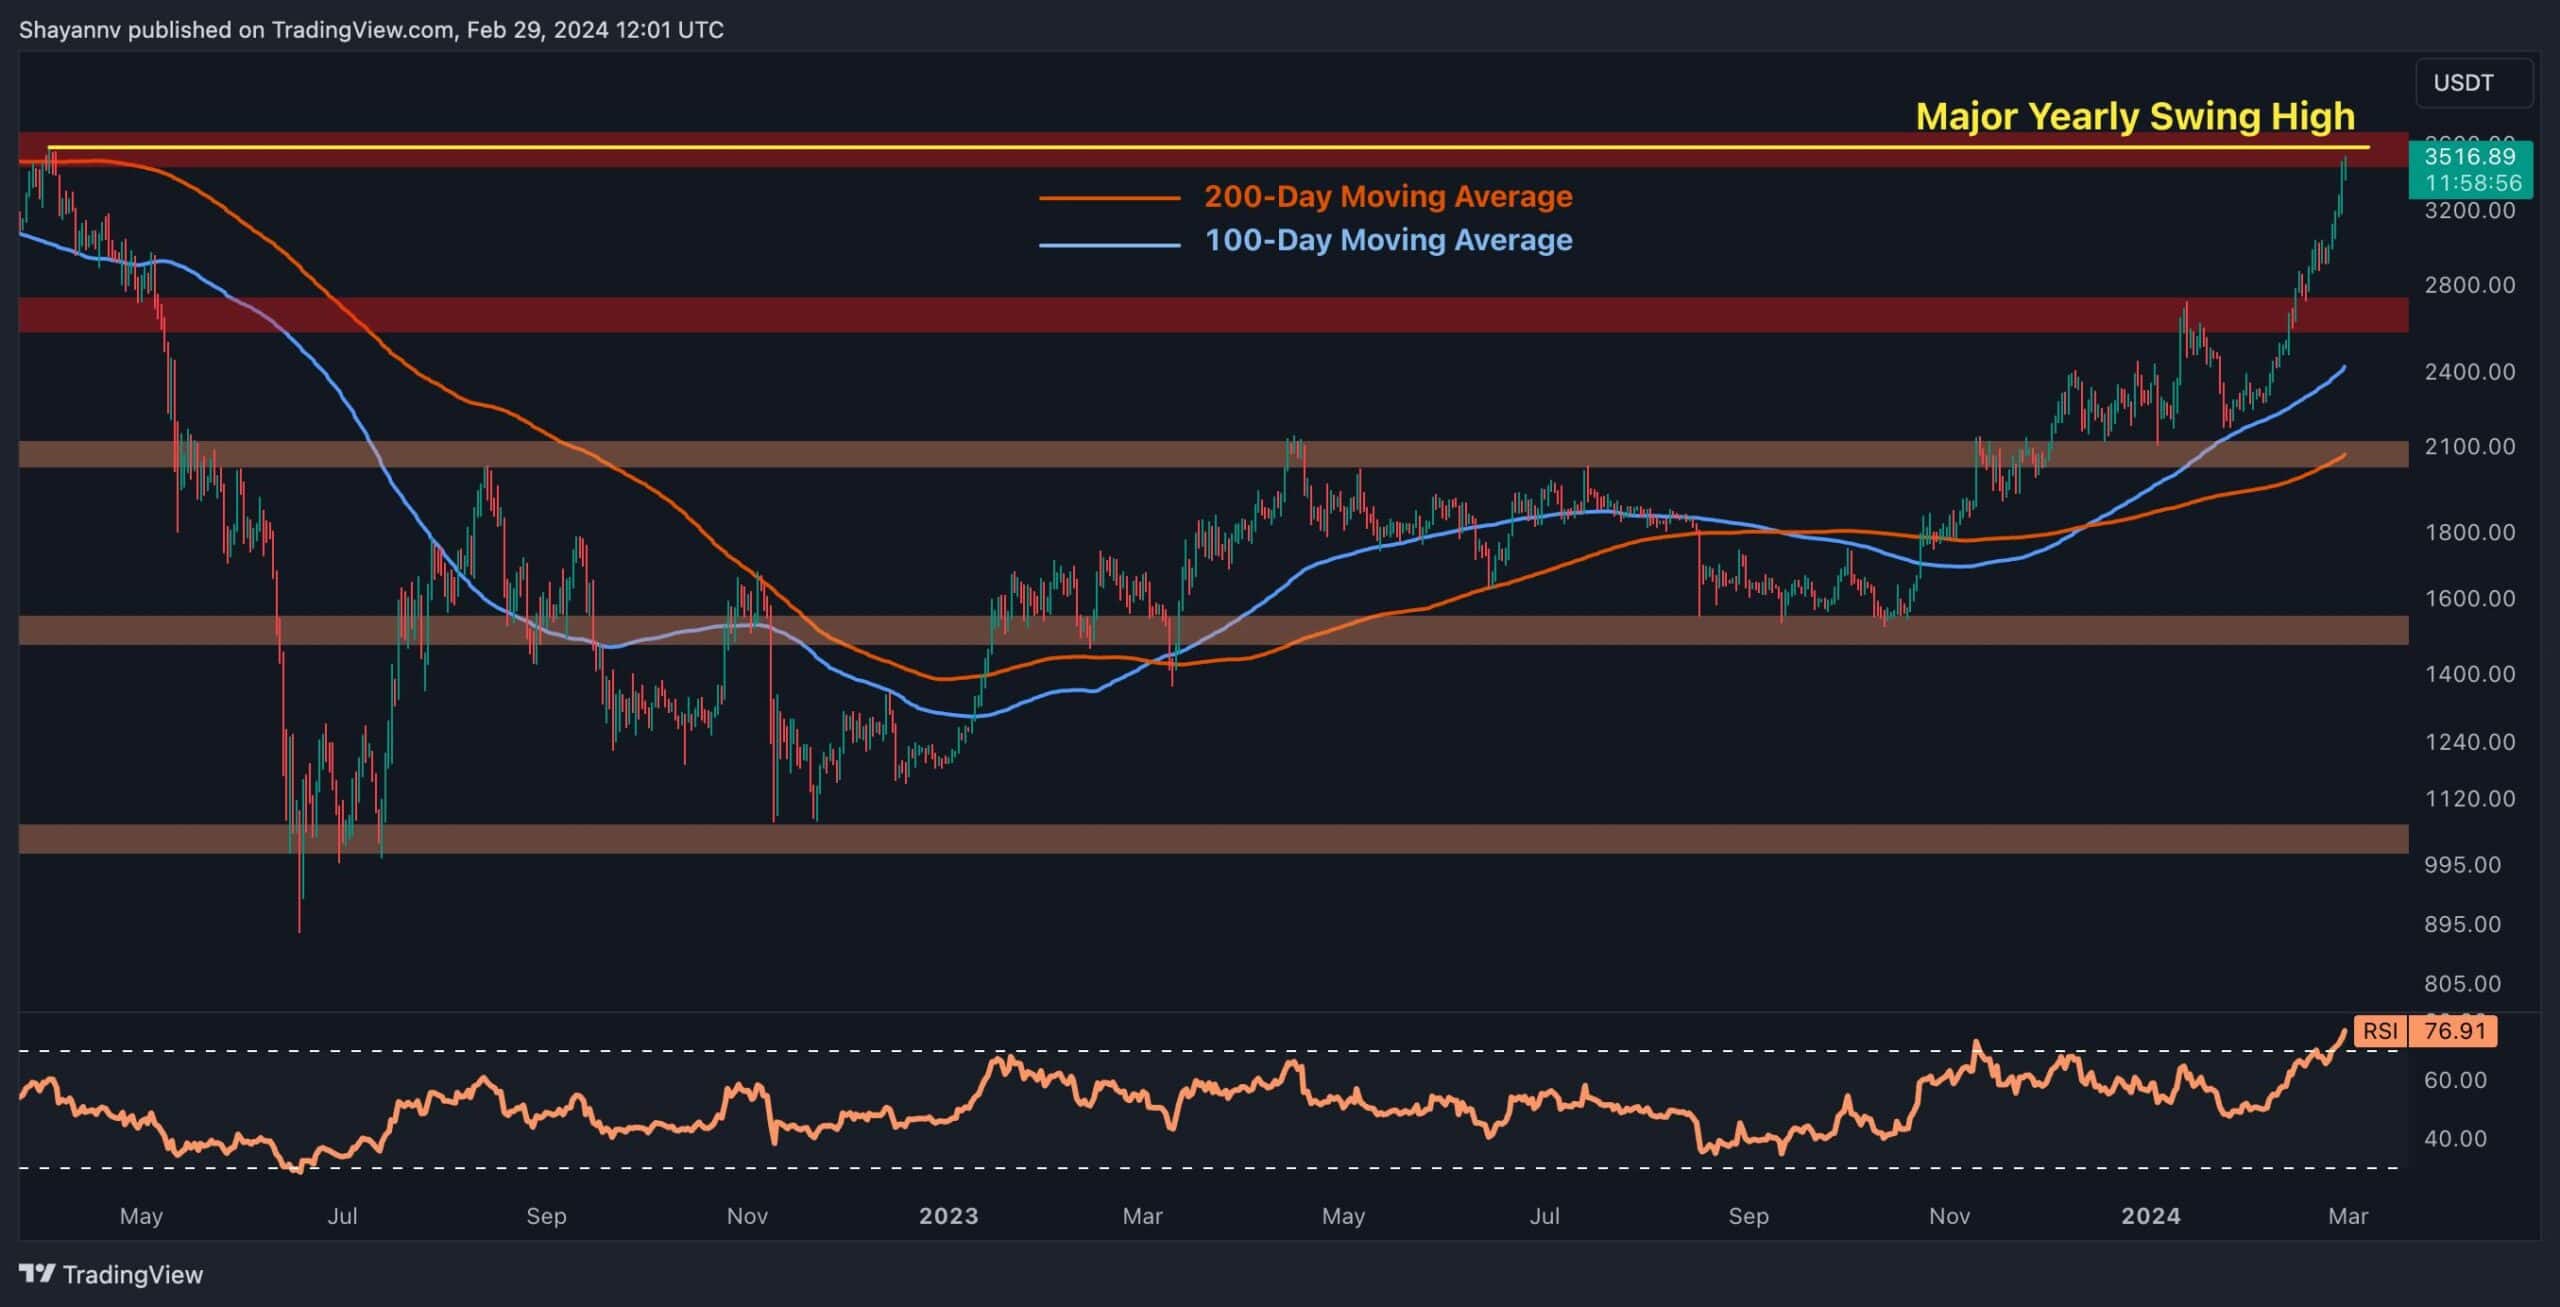
Ethereum’s price has encountered intensified buying activity, driving a significant surge towards a pivotal resistance zone, notably the previous major yearly high at $3.6K.
A breakthrough above this crucial level could set the stage for Ethereum to establish a new all-time high (ATH) in the near term.
Technical Analysis
By Shayan
The Daily Chart
A detailed examination of the daily chart underscores Ethereum’s robust bullish momentum, as the price undergoes a substantial and impulsive upward movement, reaching the critical resistance area represented by the prior major yearly high of $3.6K.
Despite the formidable barrier at $3.6K, Ethereum’s overall outlook remains highly bullish, with market participants largely anticipating a successful breach of this level in the coming weeks.
Such a breakthrough would likely signal the expansion of the uptrend towards Ethereum’s ATH, positioning the price for a new high in the medium term. However, until such a breakout occurs, the $3.6K price range is likely to serve as a containment zone for Ethereum’s movements.
 Source: TradingView
The 4-Hour Chart
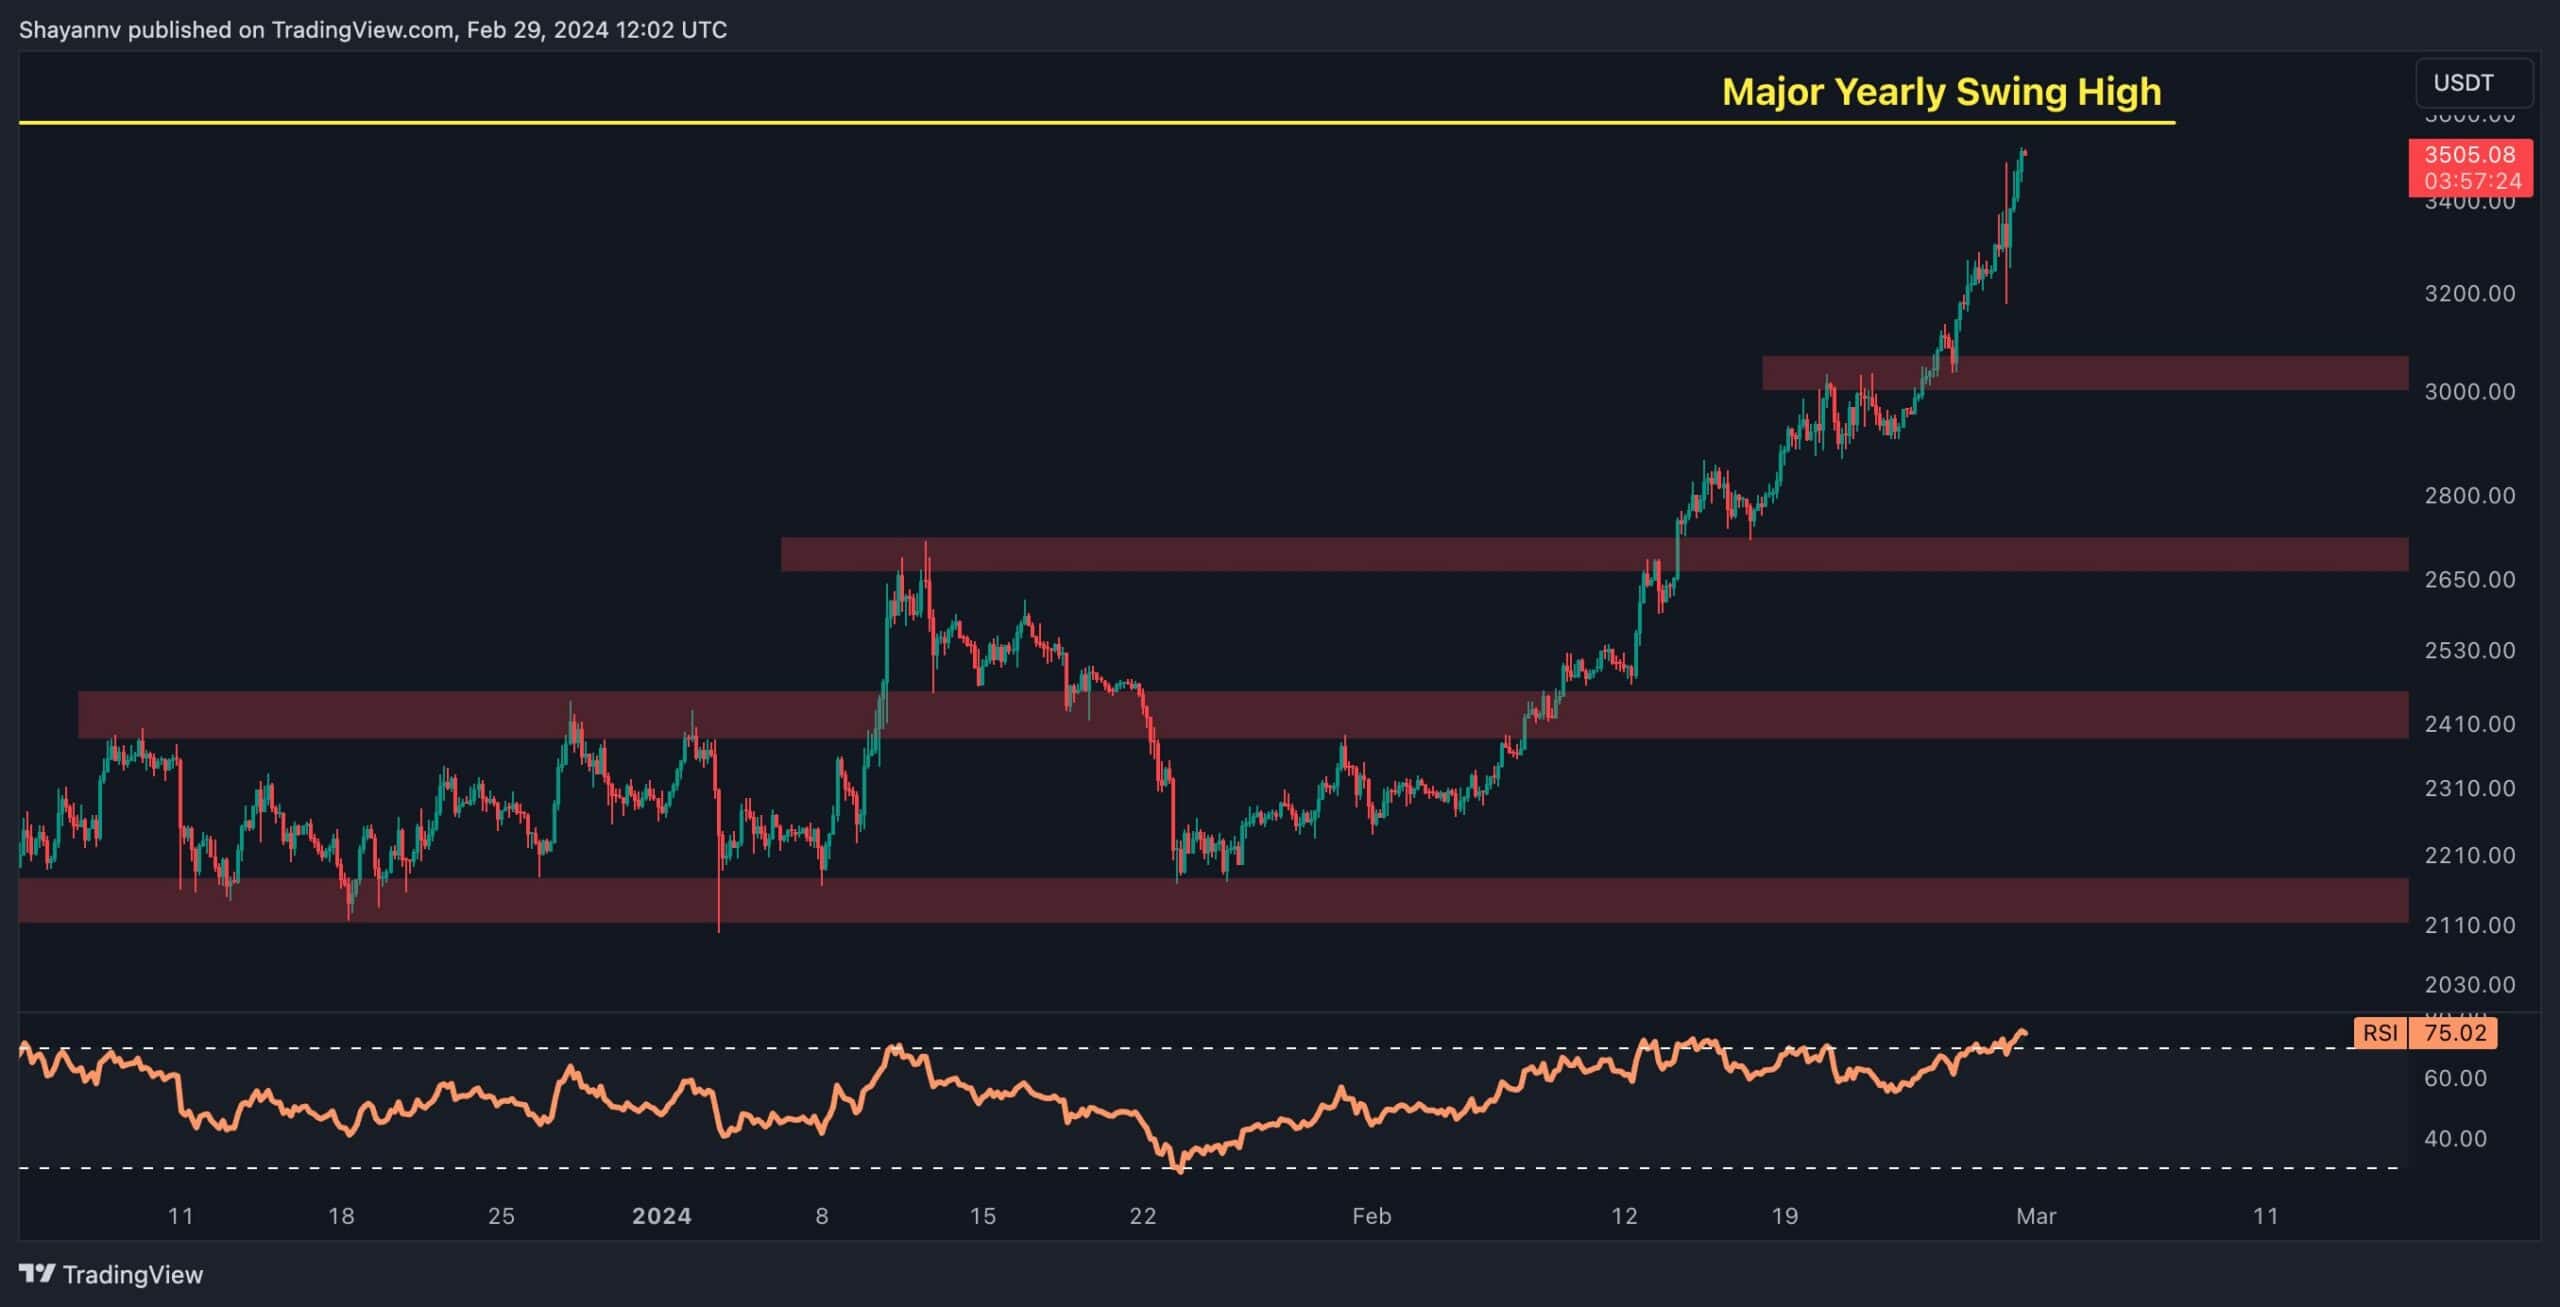
Analyzing the 4-hour chart further confirms Ethereum’s robust upward trajectory, propelling it to its highest level since April 2022. This surge, accompanied by a series of higher highs and higher lows, reflects significant buying interest aimed at pushing Ethereum toward the notable resistance level of its ATH at $4.8K.
Nevertheless, Ethereum currently finds itself in close proximity to a substantial resistance zone defined by the critical $3.6K threshold. Given the strength of this price range and the rapid ascent of the current bullish rally, periodic correction phases are expected within the overarching trend to allow for market consolidation. Key support levels to monitor during such corrections include $3K, $2.8K, and $2.5K.
While short to mid-term corrections may introduce volatility, the overall sentiment remains positive, with Ethereum poised for further upside potential.
 Source: TradingView
On-chain Analysis
By Shayan
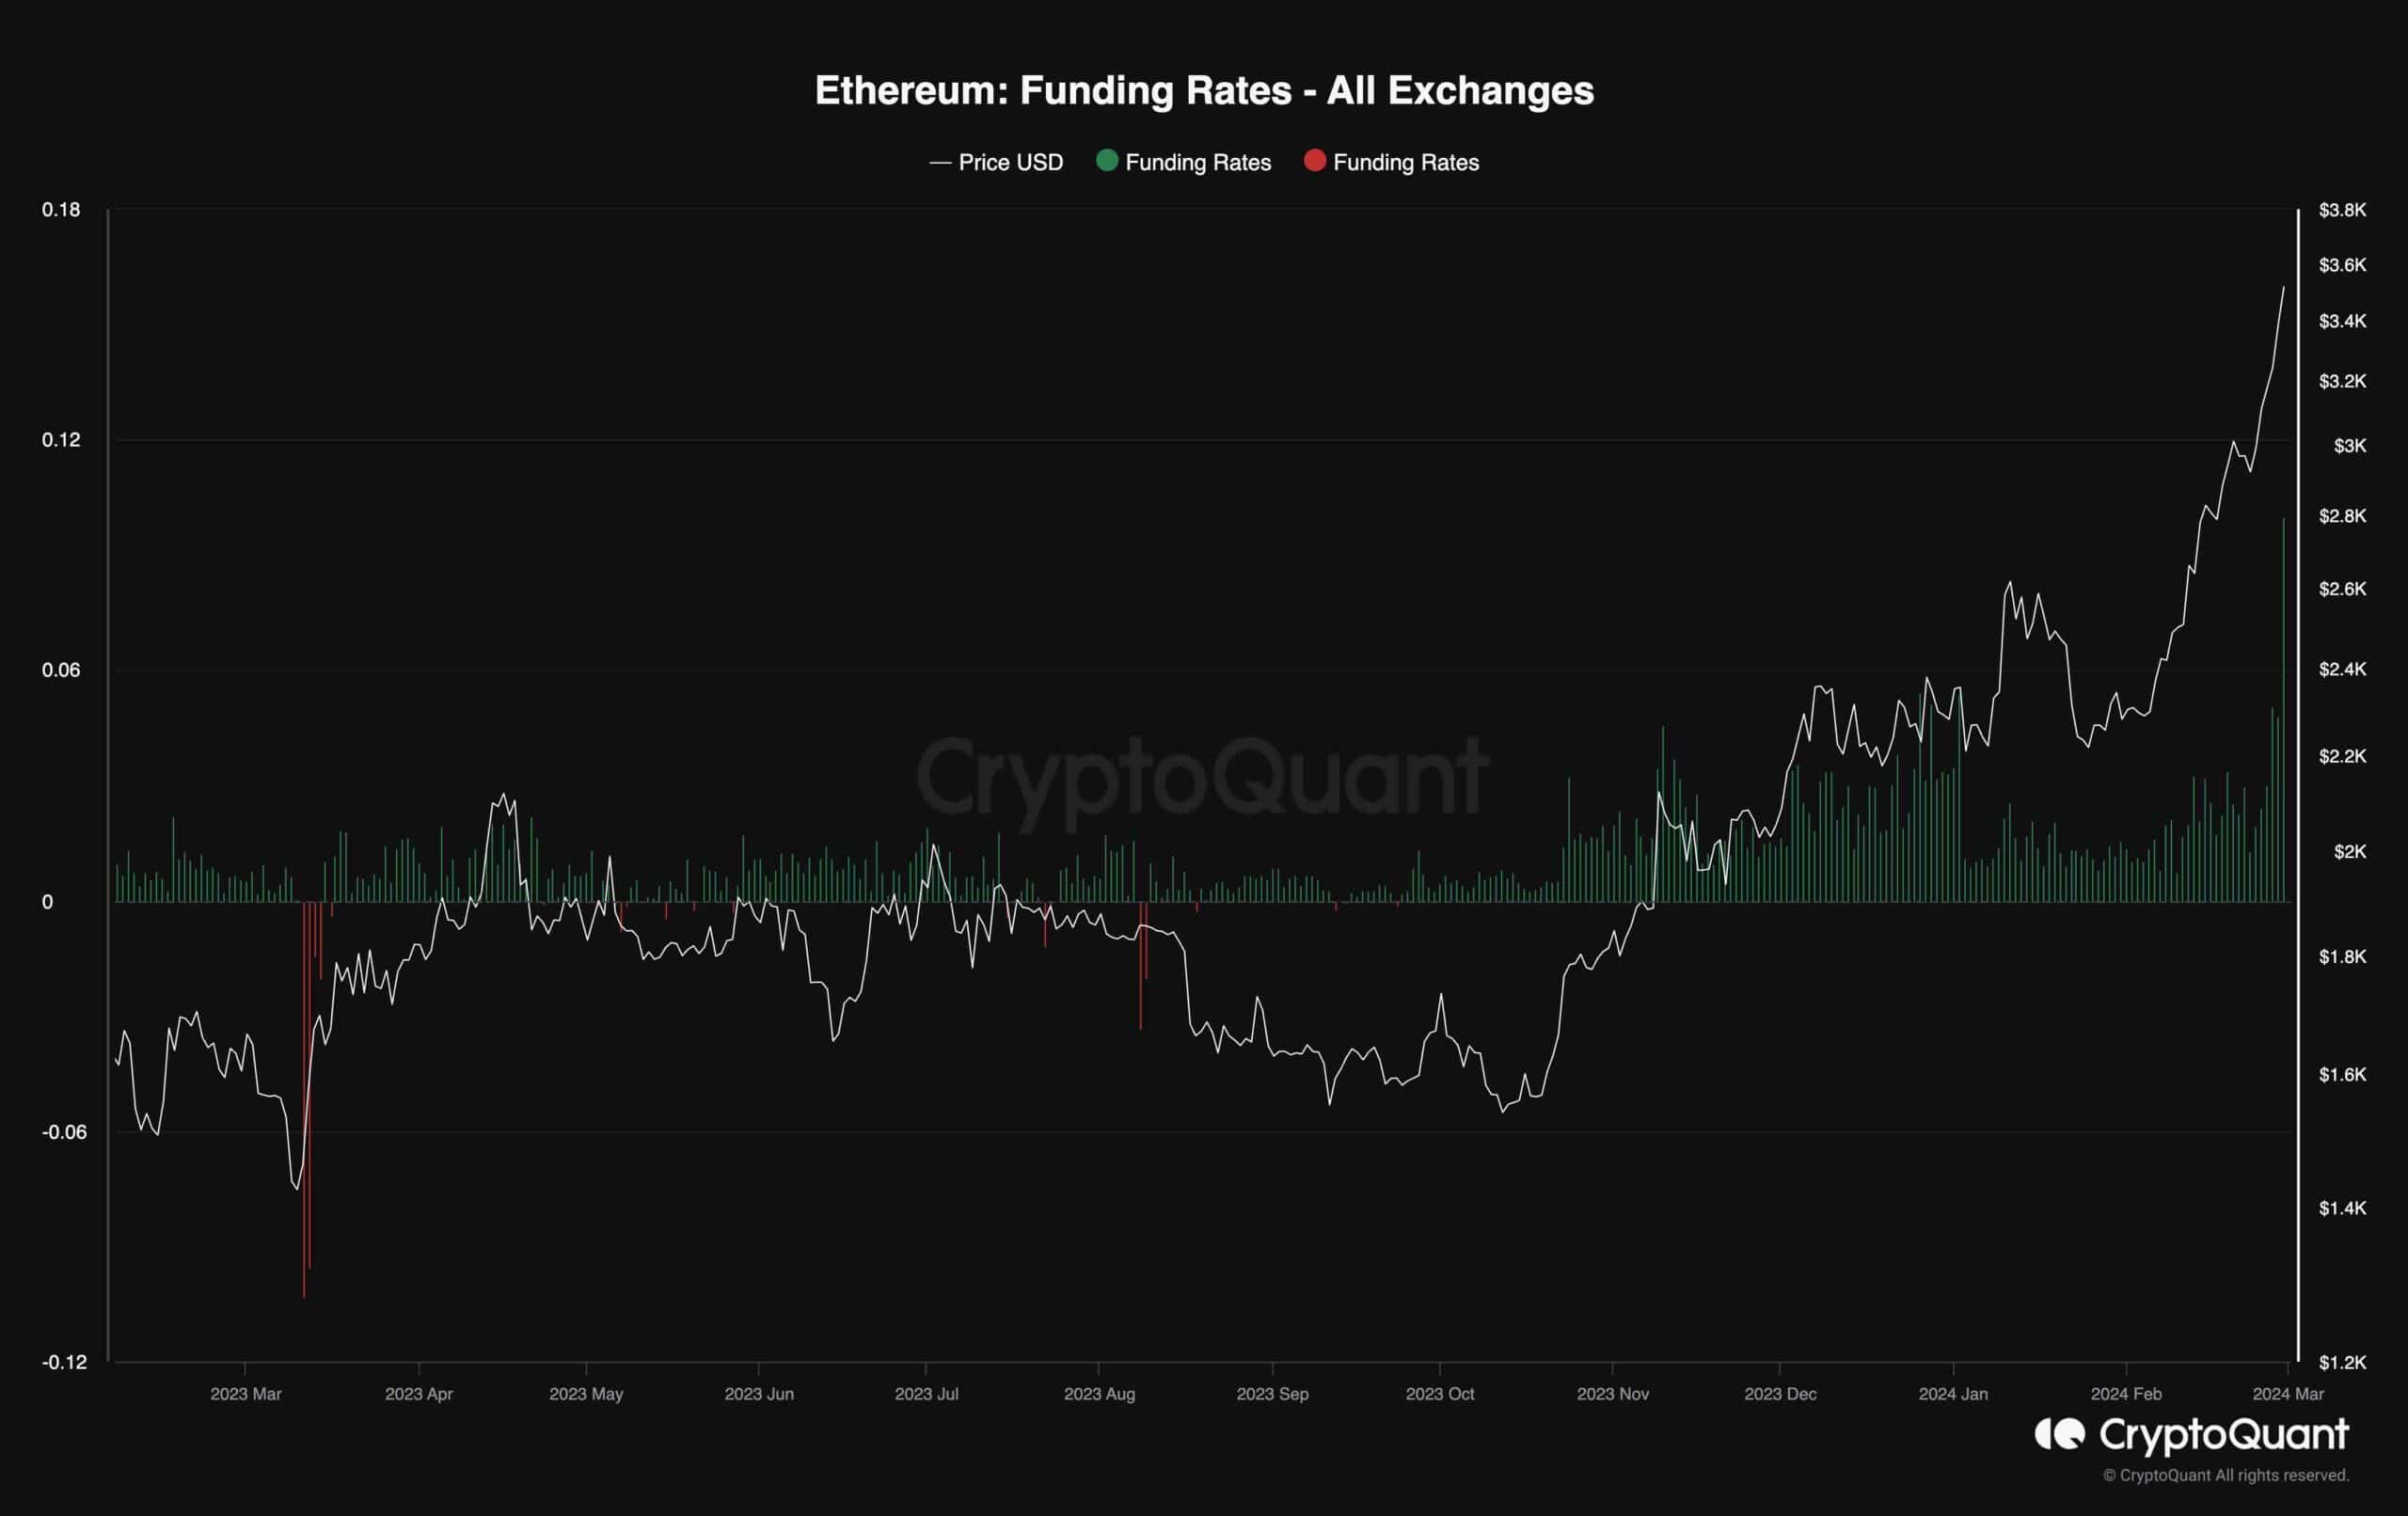
Ethereum has surged significantly, underscoring investor confidence and a surge in buying activity. A key metric reflecting market dynamics is Ethereum’s funding rates, which gauge the aggressiveness of trades executed by buyers and sellers in the futures market. Positive rates indicate a bullish outlook, whereas negative rates suggest bearish sentiment among traders.
Recently, Ethereum’s funding rates have surged in tandem with its price uptrend, signaling a sustained bullish trajectory. However, while increasing funding rates typically align with bullish market sentiment, excessively high values can present challenges. Elevated rates raise the risk of long liquidation cascades, potentially triggering unexpected price retracements. Therefore, it’s essential to closely monitor funding rates amid Ethereum’s bullish momentum to gauge market stability and anticipate potential price movements.
 Source: CryptoQuant
The post Ethereum Tests $3.5K as Traders Set Higher Targets (ETH Price Analysis) appeared first on CryptoPotato.
.png)
 10 months ago
3


 English (US)