.png)
 1 week ago
2
1 week ago
2
ARTICLE AD BOX

The post Ethereum vs Bitcoin: Why ETH Is Underperforming Amid Market Turmoil appeared first on Coinpedia Fintech News
As global markets reel from Trump’s new “Liberation Day” tariffs and a sudden liquidity crunch, the crypto market is undergoing one of its most severe drawdowns since 2020. While Bitcoin has managed to hold relatively better ground, Ethereum is facing sharper losses. This is raising questions about why ETH is bleeding more than BTC in this downturn. Read on!
Market Mayhem: A Rapid Drop Across Risk Assets
In the last seven days, almost all the major markets, including the US, have experienced severe downward pressure. The US market has dropped by 0.68%, Europe by 4.65%, China by 3.28%, India by 3.53% and Australia by 1.21%.
Similarly, all the major asset classes, especially those closely connected to the US market, suffered serious selling pressure. Since April 1, the WTI Crude Oil price has declined by nearly 13.79. Between April 3 and 7, even the price of gold (widely considered as a safe asset) dropped over 4.74%.
The situation in the cryptocurrency market is not different. In the last seven days, the top two cryptos, Bitcoin and Ethereum, have slipped by at least 1.1% and 11%, respectively.
It appears that the economic mayhem has inflicted more injuries on Ethereum, compared to Bitcoin. Let’s analyse further!
Capital Flows Dry UP: Ethereum Feels the Squeeze
According to a research report, the ETH markey saw capital inflows of +15.5B/month at its peak but is now experiencing outflows of -$6B/month. In contrast, the BTC market’s inflows have slowed but are still positive at +6B/Month.
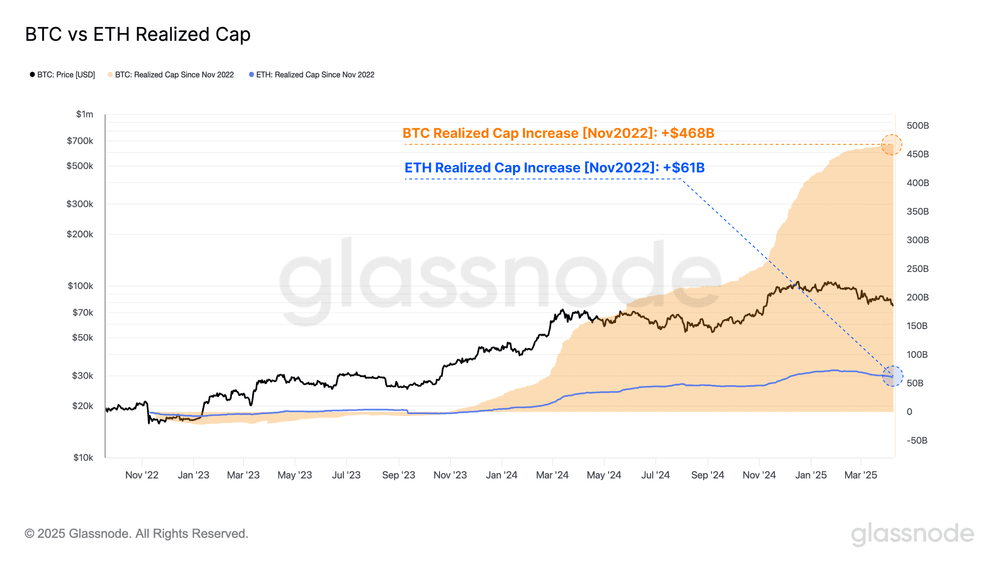 Source : glassonde
The BTC vs ETH Realised Cap chart shows that since late 2022, Etheruem’s realised cap grew by only +32%, form $183B to $244B. However, the realised cap of Bitcoin during the period surged by at least +117%, from $402B to $870B.
This means that BTC has attracted much more investor demand than Ethereum in this cycle.
ETH Holders in the Red: MVRV Ratio Dips Below 1.0
As per the BTC vs ETH MVRV chart, the MVRV ratio of ETH has declined below 1.0, and the same ratio of BTC has stayed above 1.0. The MVRV ratio is the ratio between the market value of a crypto-asset and its realised value.
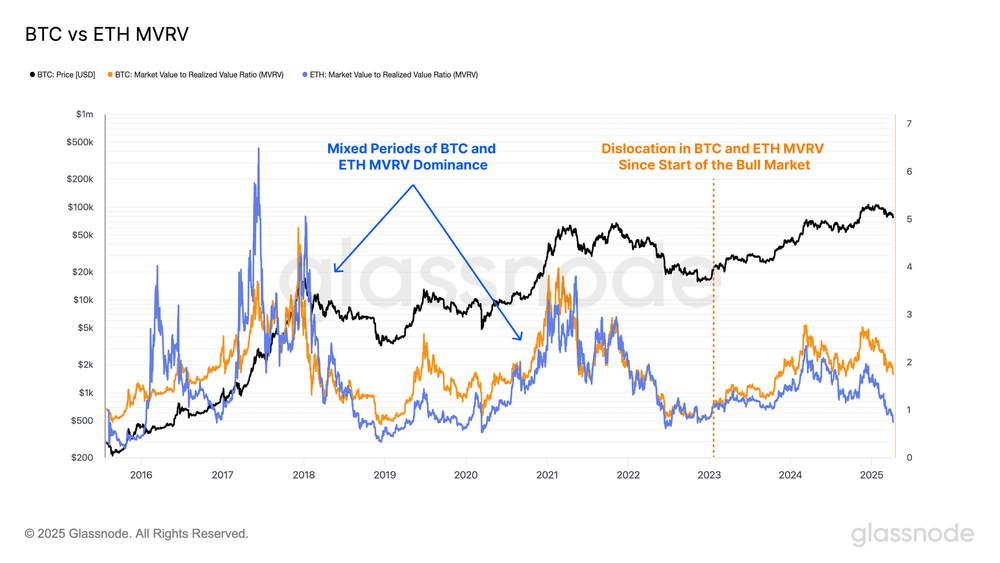 Source : glassonde
This chart indicates that average ETH holders are now at a loss, but BTC holders still have paper profits. Investors in loss are more likely to sell. This explains increasing selling pressure in the Ethereum market.
Bitcoin Dominance: 800+ Days of Outperformance
The report reveals that Bitcoin holders have had higher average profit than ETH holders for 812 consecutive days. This long-term underperformance adds to the weaker sentiment around ETH.
ETH/BTC Pair Signals Alarming Divergence
Since September 2022, the ETH/BTC pair has dropped at least 75%. At the start of this month, the Ethereum/Bitcoin pair was at 0.02207. Since then, the market has slipped by over 11.46%.
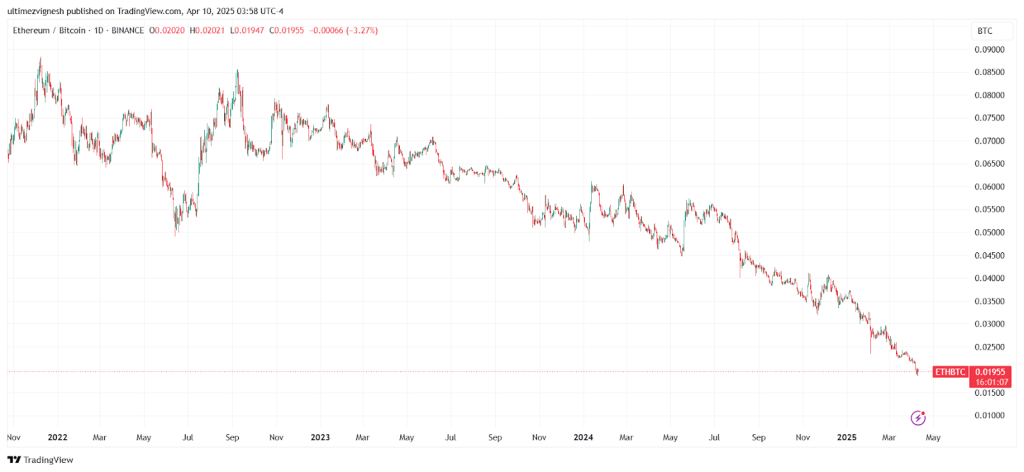 Source : Tradingview
This also shows that Etherem is severely underperforming compared to Bitcoin.
What’s Next: Can ETH Recover Its Momentum?
The report states that ETH investors locked in $564M in realised losses, compared to $240M for BTC during the latest sell-off.
Notably, in the past bull markets, ETH would occasionally outperform BTC, This cycle =m that has not happened.
In conclusion, with investor sentiment weakening and capital flows drying up, Etheruem’s underperformance may continue unless strong bullish momentum returns.
Never Miss a Beat in the Crypto World!
Stay ahead with breaking news, expert analysis, and real-time updates on the latest trends in Bitcoin, altcoins, DeFi, NFTs, and more.


 English (US)