ARTICLE AD BOX
The Injective (INJ) price dynamics reveal that 83% of active holders are at break-even, hinting they’re awaiting a price rebound. Concurrently, INJ’s active addresses have recently increased after a late March dip.
Additionally, the EMA lines suggest a solid consolidation pattern following a 14.62% correction last month. This combination of factors signals a potential upward trajectory for INJ as the market stabilizes and investors remain hopeful.
These Holders Can Prevent Selling Pressure
The INJ price has recently shown signs of recovery, growing 5% in the last seven days. This comes after INJ decreased from $51 on March 12 to $35.48 on March 24. This rebound is a crucial indicator of potential upward momentum as the INJ market endeavors to emerge from a period of consolidation that had previously dampened enthusiasm.
 Injective Active Addresses by Profitability. Source: IntoTheBlock.
In this context, the role of active addresses becomes increasingly pivotal. Currently, 83% of addresses are at break-even point. These holders are probably awaiting an opportunity for the price to surge, thereby unlocking potential profits.
This optimism among holders, who are closely monitoring the market for signs of further gains, suggests a strong belief in INJ’s value proposition. It’s this collective sentiment that could potentially catalyze additional bullish momentum.
Read More: Top 9 Web3 Projects That Are Revolutionizing the Industry
INJ Active Addresses Are Rising Again
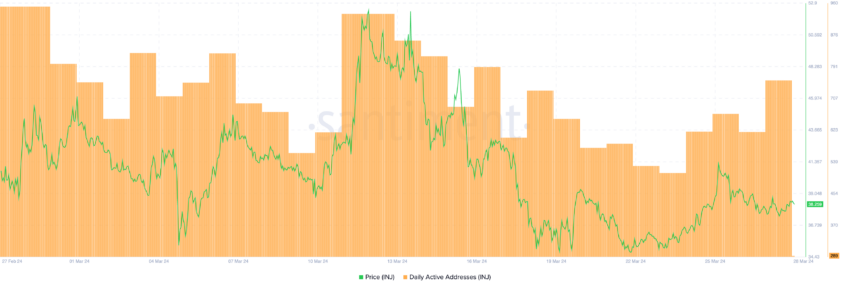
INJ recently witnessed an increase in daily active addresses, climbing from 509 on March 24 to 755 by March 28. This uptick follows a period of consistent decrease in active addresses from mid to late March, where the count dropped from 932 on March 12 to 509 on March 24.
Concurrently, the price of INJ experienced a significant reduction, moving from $51 to $35.30. That represents a correction of approximately 30.78%.
 INJ Daily Active Addresses. Source: Santiment.
This recent growth in daily active addresses is a positive signal for INJ, suggesting a revitalization of user engagement and interest in the network.
After a period of declining activity and price, this resurgence indicates a potential reversal of trends, where increased network participation could further stimulate demand for INJ, supporting a recovery in its price and enhancing overall market sentiment.
INJ Price Prediction: What Happens Next?
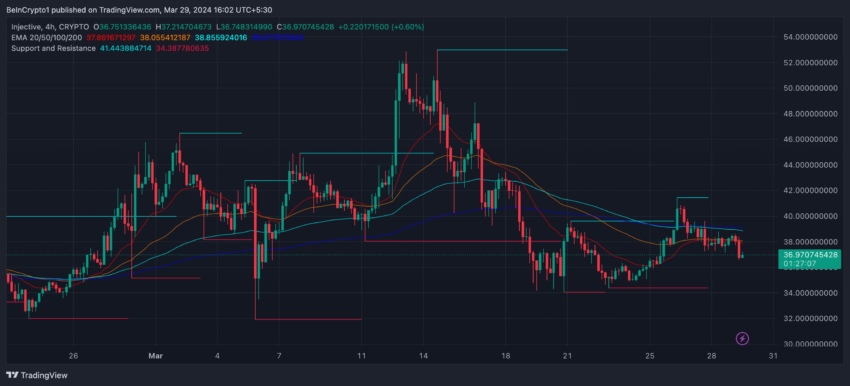
The 4-hour chart for Injective (INJ) shows a confluence of Exponential Moving Averages (EMAs) closely huddled around the current price, signaling a compressed market. Notably, the shorter-term lines residing below the longer-term ones typically suggest a bearish outlook; the market’s immediate momentum is slowing relative to its past vigor.
EMAs are trend-following indicators, averaging prices over time while giving greater weight to recent data, which helps to identify trend direction and strength.
 INJ 4H Price Chart and EMA Lines. Source: TradingView.
 Currently, INJ faces a possible drop to $30 during this consolidation, a phase marked by tight price action without clear direction. Although the EMAs present a not-so-bullish picture, the network’s strong metrics, like the number of active addresses, coupled with the fact that 83% of holders are at break-even, could dampen any aggressive selling.
Read More: Top 11 DeFi Protocols To Keep an Eye on in 2024
These factors reinforce the consolidation scenario. Should an uptrend materialize, buoyed by these underlying strengths, INJ could make a swift return to the $44 mark.
The post Injective (INJ) Holders Stuck at Break-Even: Waiting for Push to $44 Next? appeared first on BeInCrypto.
.png)
 7 months ago
8


 English (US)