ARTICLE AD BOX
Kaspa’s (KAS) price has gained bullish momentum on both the four-hour and daily timeframes.
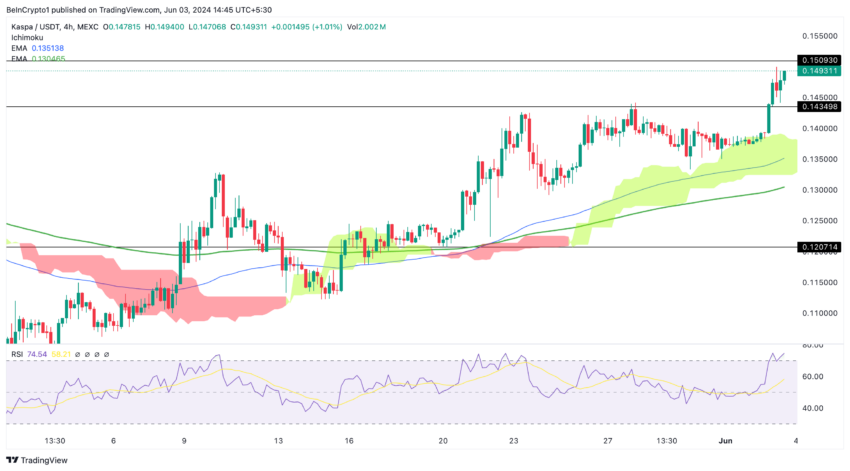
On the 4H chart, Kaspa (KAS) has broken above the Ichimoku cloud, indicating a strong upward trend. On a daily basis, Kaspa (KAS) has broken above the Ichimoku cloud, a very bullish sign given the cloud’s significance.
Kaspa Price Analysis
The KAS price has gained bullish momentum on both the four-hour and daily timeframes. Here are the key observations:
Bullish Breakout on 4H Chart:
KAS/USDT has broken above the Ichimoku cloud on the 4-hour chart, indicating a strong upward trend. The key resistance level to watch is $0.150, and the key support level to monitor is $0.143.
The 4-hour RSI is at 74.54, indicating overbought conditions. This suggests the price might see a short-term pullback or consolidation before potentially continuing its upward trend.
Read More: How To Buy KASPA And Everything You Need to Know
 Kaspa Price analysis (4H). Source: TradingView
Significant Daily Breakout:
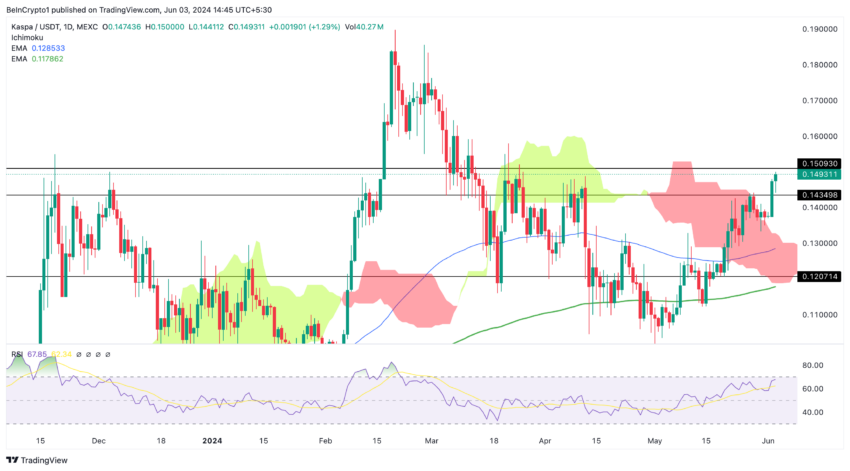
On a daily basis, KAS has broken above the Ichimoku cloud, which is a very bullish sign. The daily Ichimoku cloud is more significant and sensitive to price movements than clouds on lower timeframes.
Moreover, the price has broken through the baseline plateau at $0.143, which is a very bullish sign. The resistance level to watch is $0.150, corresponding to an important flat Ichimoku baseline. The support level to monitor is $0.143, which is also a significant flat Ichimoku baseline.
The daily RSI is at 67.85, nearing overbought conditions. This indicates strong bullish momentum but also signals that the price might slow down or consolidate soon.
Potential for Price Reversal:
A retest of the $0.143 support level could lead to a price reversal. If the price fails to hold this support, it could penetrate the 4-hour Ichimoku cloud to the downside, signaling a potential bearish shift.
 Kaspa Price Analysis(1D). Source: TradingView
Monitoring KAS Trend Continuation:
Continued bullish momentum is confirmed if the price remains above the Ichimoku cloud and the key support levels.
Watch for consolidation or pullbacks at the resistance levels to assess the trend’s strength. Monitoring these levels is crucial for traders and investors who want to be exposed to Kaspa’s price performance.
The Ichimoku Cloud, also known as Kumo, is a comprehensive technical analysis tool that helps traders identify trends, support, and resistance levels, and potential reversal points.
Baseline: This is the midpoint of the highest high and lowest low over the last 26 periods. It is a key indicator of medium-term price movement and potential support or resistance.
Flat sections of the Baseline line, known as plateaus, represent important support or resistance levels. These plateaus occur because the market has spent significant time at these price levels, indicating strong buying or selling interest.
Strategic Recommendations
To capitalize on Kaspa’s bullish outlook, monitor the key resistance level at $0.150 and leverage the Ichimoku cloud signals. Remaining above the cloud on both the 4-hour and daily charts suggests continued upward momentum.
Evaluate RSI conditions for potential short-term pullbacks, which could present buying opportunities, and stay updated with market news that might fuel the bullish trend.
Read More: Kaspa (KAS) Price Prediction 2024/2025/2030
Conversely, watch the support level at $0.143 closely; a break below this level could signal a price reversal and a bearish shift.
In such a scenario, consider exiting long positions, preparing for downside risk, utilizing stop-loss orders to manage potential losses, and confirming trend continuation by observing price movements relative to the Ichimoku cloud and key support levels.
The post Kaspa (KAS) Price Bullish, All-Time High in Sight appeared first on BeInCrypto.
.png)
 5 months ago
3


 English (US)