ARTICLE AD BOX
Chainlink is currently trading at critical demand levels as the broader crypto market faces ongoing pressure. With global financial conditions growing increasingly fragile, volatility continues to dominate across risk assets. Geopolitical tensions and sweeping tariffs imposed by world leaders — including recent moves by US President Donald Trump — have only added to the uncertainty, shaking investor confidence and stalling bullish momentum in crypto.
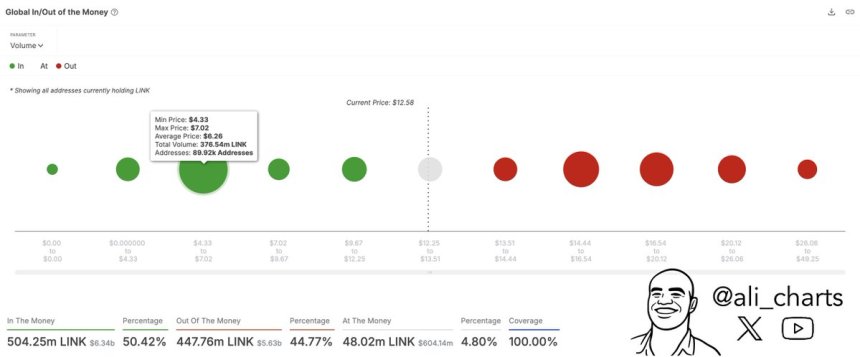
Amid this backdrop, Chainlink has struggled to reclaim higher ground, instead consolidating around a key support zone. According to on-chain data, LINK’s most critical demand wall sits at $6.26. This concentration of buying interest marks a potentially strong support area that bulls must defend to avoid a deeper correction.
As markets react to shifting macroeconomic signals, Chainlink’s ability to hold this demand zone could determine its next move. If this level fails, additional downside may follow. But if it holds, it could serve as the base for a potential rebound once sentiment improves. For now, all eyes remain on LINK’s price action as it tests one of the most important accumulation zones on its chart.
Chainlink Consolidates As Next Demand Level Lies Below
Despite broader market uncertainty, Chainlink remains one of the most prominent players in the real-world asset (RWA) tokenization narrative — a sector expected to see substantial growth in the coming years. As traditional finance continues exploring blockchain infrastructure, Chainlink’s oracle technology and decentralized data feeds remain essential to bridging off-chain assets with on-chain applications.
However, in the short term, LINK’s price action has mirrored the broader crypto market downturn. Chainlink is down 17% since March 26, with current price action showing continued uncertainty. LINK is consolidating just above a key demand level, and although bulls have struggled to regain momentum, some analysts believe the worst may be behind. Fears of ongoing selling pressure persist, but overall market conditions suggest that the sharpest drawdowns could be over.
Supporting this view, Ali Martinez shared on-chain data revealing that the most critical demand wall for Chainlink sits at $6.26, where nearly 90,000 investors accumulated approximately 376 million LINK tokens. This strong accumulation zone may provide the foundation needed for price stabilization and a potential reversal, especially if broader market sentiment begins to recover.

While analysts still warn of a possible deeper correction, the fading intensity of selling and the presence of strong support indicate growing resilience. Chainlink’s long-term fundamentals, particularly its leadership in the RWA space, continue to attract attention — even during times of market stress. If the $6.26 level holds, LINK could be well-positioned for a rebound once bullish momentum returns across the crypto landscape.
LINK Holds Solid Ground As Bulls Eye Recovery Confirmation
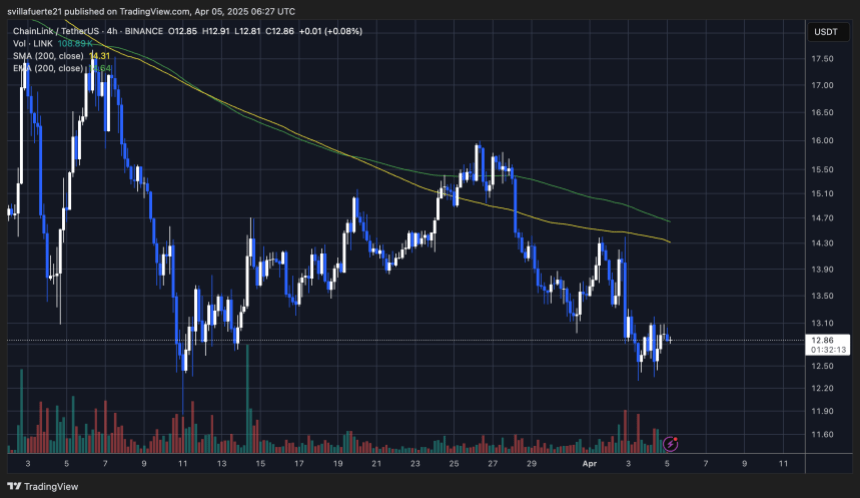
Chainlink (LINK) is trading at $12.8 after enduring several days of heavy selling pressure. Despite the recent downside, bulls have managed to defend the crucial $12.3 support level, which has so far acted as a solid demand zone. This hold is a key short-term victory, but the broader trend remains fragile as LINK struggles to regain upward momentum.

To confirm a potential recovery rally, bulls must push LINK above the $14.6 level — a critical resistance zone that aligns with both the 4-hour 200-day moving average (MA) and the exponential moving average (EMA). A decisive breakout above this area would signal renewed strength and potentially attract more buyers back into the market.
However, the risk of further downside still looms. If LINK loses its grip on the $12.3 demand zone, the next logical support could lie near the $10 mark, a psychological level that hasn’t been tested since early Q4 2023. With the broader crypto market still under pressure and sentiment cautious, LINK remains at a crossroads. The coming days will be pivotal as bulls attempt to reclaim momentum and avoid slipping deeper into correction territory.
Featured image from Dall-E, chart from TradingView
.png)
 12 hours ago
1


 English (US)