ARTICLE AD BOX
Optimism (OP) price is prime for the picking since the broader market cues and investors’ behavior are signaling a buy signal.
The question remains: will OP generate more profits than it has since the beginning of the year, or will it be stopped mid-way?
Optimism Among Investors Is High
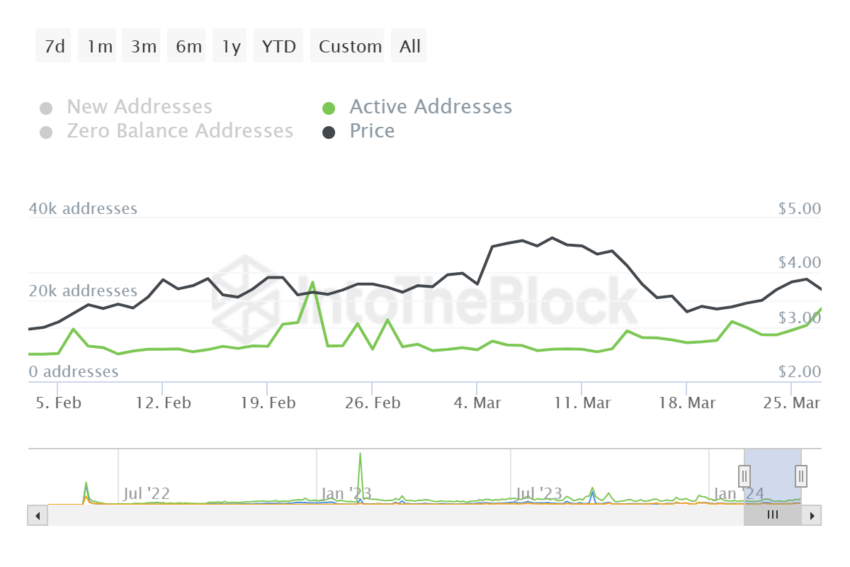
Although the beginning of the month was bleak for Optimism price, the altcoin found its footing in the last few days. This was the result of an increase in participation from OP holders. This is evident from the surge in active addresses, which has grown by over 30% in the last 24 hours.
 Optimism Active Addresses. Source: IntoTheBlock
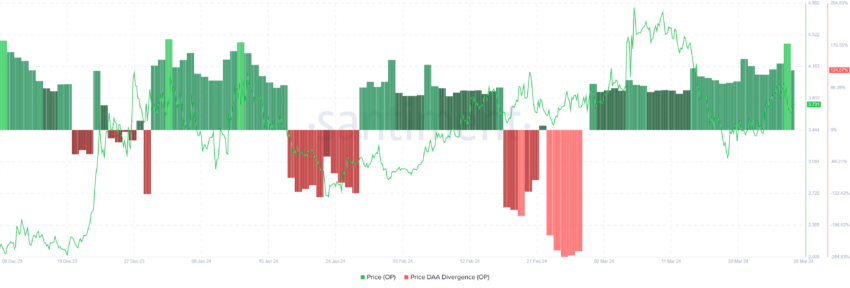
Along with the increased activity of investors on the network and the decline in price, Optimism is exhibiting a buy signal. According to the price daily active addresses (DAA) divergence, OP is a good asset to accumulate at the moment.
Read More: What Is Optimism?
Price-Daily Active Addresses (DAA) Divergence occurs when a cryptocurrency’s price and the number of daily active addresses show contrasting trends, indicating potential discrepancies between market valuation and actual network usage or adoption. When the price goes down and participation increases, a buy signal is flashed, and vice versa.
 Optimism Price DAA Divergence. Source: Santiment
Thus, if Optimism holders move to add OP to their wallets, the price could see a surge.
OP Price Prediction: Profits on the Way
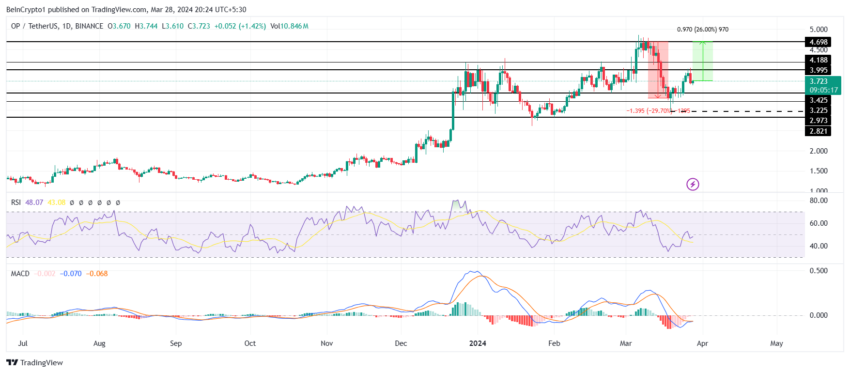
Optimism’s price is presently trading at $3.72 after failing to breach the resistance marked at $3.99. Crossing this barrier would enable OP to reclaim $4.00 as a support floor, which will enable a rise towards $4.69, marking a new year-to-date high as well as a 26% rally.
Both the Relative Strength Index (RSI) and Moving Average Convergence Divergence (MACD) indicate potential bullishness. RSI measures price momentum, indicating overbought or oversold conditions. MACD, on the other hand, is a trend-following indicator showing the relationship between two moving averages, signaling potential buy/sell opportunities.
 OP/USDT 1-day chart. Source: TradingView
At the moment, both indicators are at the cusp of a bullish reversal, which would support the anticipated 26% rally.
Read More: Optimism vs. Arbitrum: Ethereum Layer-2 Rollups Compared
However, should OP fail to breach $4.00, Optimism’s price could note a decline of $3.42 losing, which would push the altcoin below $3.00, invalidating the bullish thesis.
The post Optimism (OP) Flashes Buy Signal: Is a 26% Price Rally Likely? appeared first on BeInCrypto.
.png)
 7 months ago
2


 English (US)