.png)
 2 hours ago
2
2 hours ago
2
ARTICLE AD BOX

- Heightened volatility suggests the potential for either a breakout for Pi Network (PI) to $4 or a pullback to lower support levels.
- The Directional Movement Index (DMI) highlights robust buying momentum, with ADX exceeding 40, signaling exceptional trend strength.
Pi Network (PI) price has seen an incredible 70% upsurge over the past 24 hours, pushing its market cap to a whopping $16 billion. Trading volume has also picked up dramatically, with the token’s 24-hour volume exceeding $2.3 billion.
As reported earlier, the PI price recently marked a new historical high at close to $3, indicating fierce bullish pressure. Nevertheless, the technical indicators portend increased volatility. The coin is now facing a decisive stage, with indicated price action taking the form of a breakout into $4 or a pullback to lower support at $1.7 or even $0.79.
Pi Network’s DMI Signals Strong Uptrend
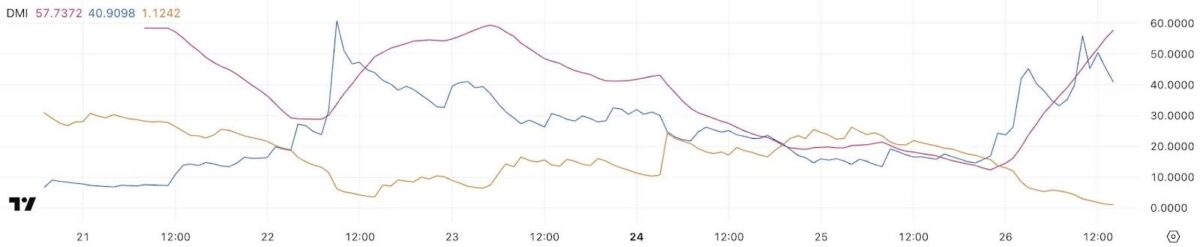 Source: TradingView
A key technical indicator, the Directional Movement Index (DMI), highlights the strength of Pi’s current trend. Since the beginning of the 24-hour period, ADX has demonstrated substantial growth from 12.3 to 57.7. The momentum becomes weak when the Average Directional Index moves below 20, but it shows moderate intensity when the index settles between 20 and 40. The ongoing trend of the Pi Network shows exceptional strength because its readings exceed 40.
The fast upward trend in Pi’s market is bolstered by both the +DI Positive Directional Indicator which rose from 14.6 to 40.9 in two days and the -DI Negative Directional Indicator dropping steeply from 19.4 to 1.1. The continuous growth of these indicators proves buying activity surpasses selling orders which demonstrates the strengthening power of Pi Network’s ascending trend.
The continuous trend of these indicators confirms that the Pi price will probably keep rising in the short term while sellers face minimal barriers to prevent this growth. In spite of the upward trend, the Bollinger Bands Trend (BBTrend) indicator shows a worrisome change in price action. Three days ago, the BBTrend level was 51.2, falling to between 1 and 3 yesterday. Today, it has dived to -11, indicating a steep fall.
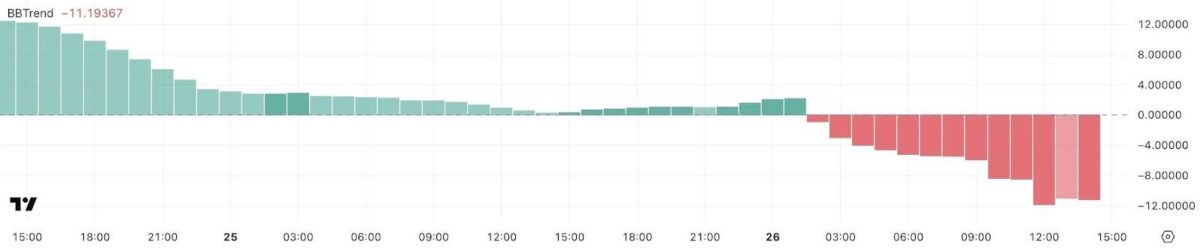 Source: TradingView
The sharp descent to -11 indicates that current price momentum has possibly reached an overbought state, leading Pi’s price to a potential short-term pullback or stabilization. This type of drop in the BBTrend reading usually means that the price of the asset has gone up too rapidly and will likely come under selling pressure. If this trend continues, Pi can expect to see a pullback to its mid-Bollinger Band or fall into a period of trading sideways before continuing with price appreciation.
Will Pi Network Reach $4?
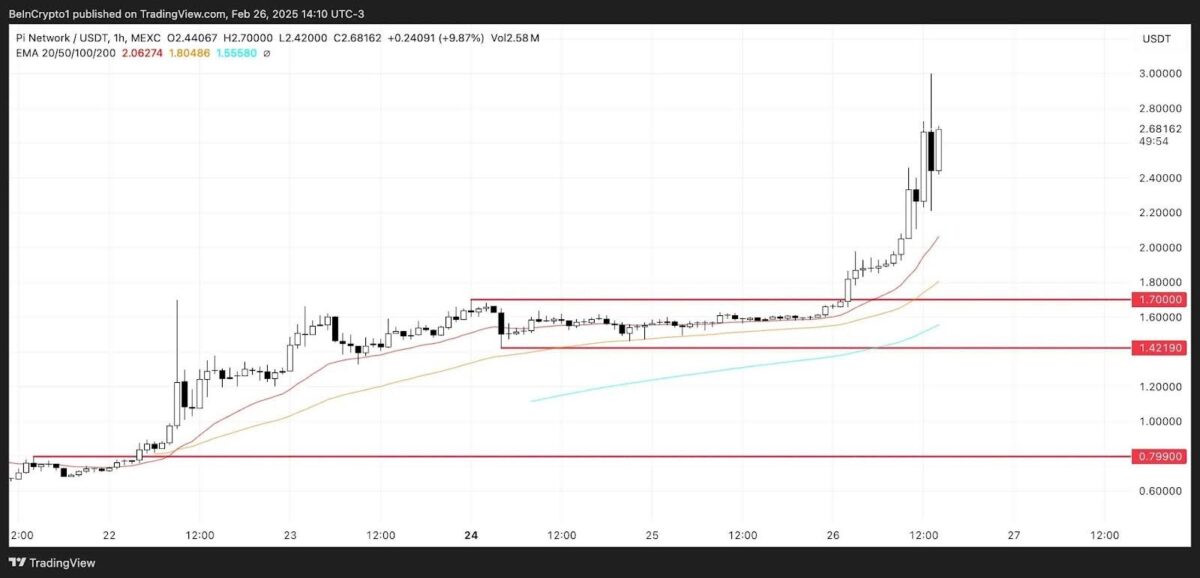 Source: TradingView
As noted in our previous story, Pi set a record high near the $3 level, sparking rumors of a possible surge to $3.5 or even $4. The steep rally indicates that sustained buying pressure may propel the token beyond the psychological $3 level.
However, the precipitous drop in the BBTrend indicator indicates fears that the rally is extended. If pressure continues to build to sell, Pi can decline toward its initial major support at $1.7. Another decline can see the price reach as low as $1.42. Pi might see a deep retracement towards $0.79 on an extreme bear case.


 English (US)