ARTICLE AD BOX
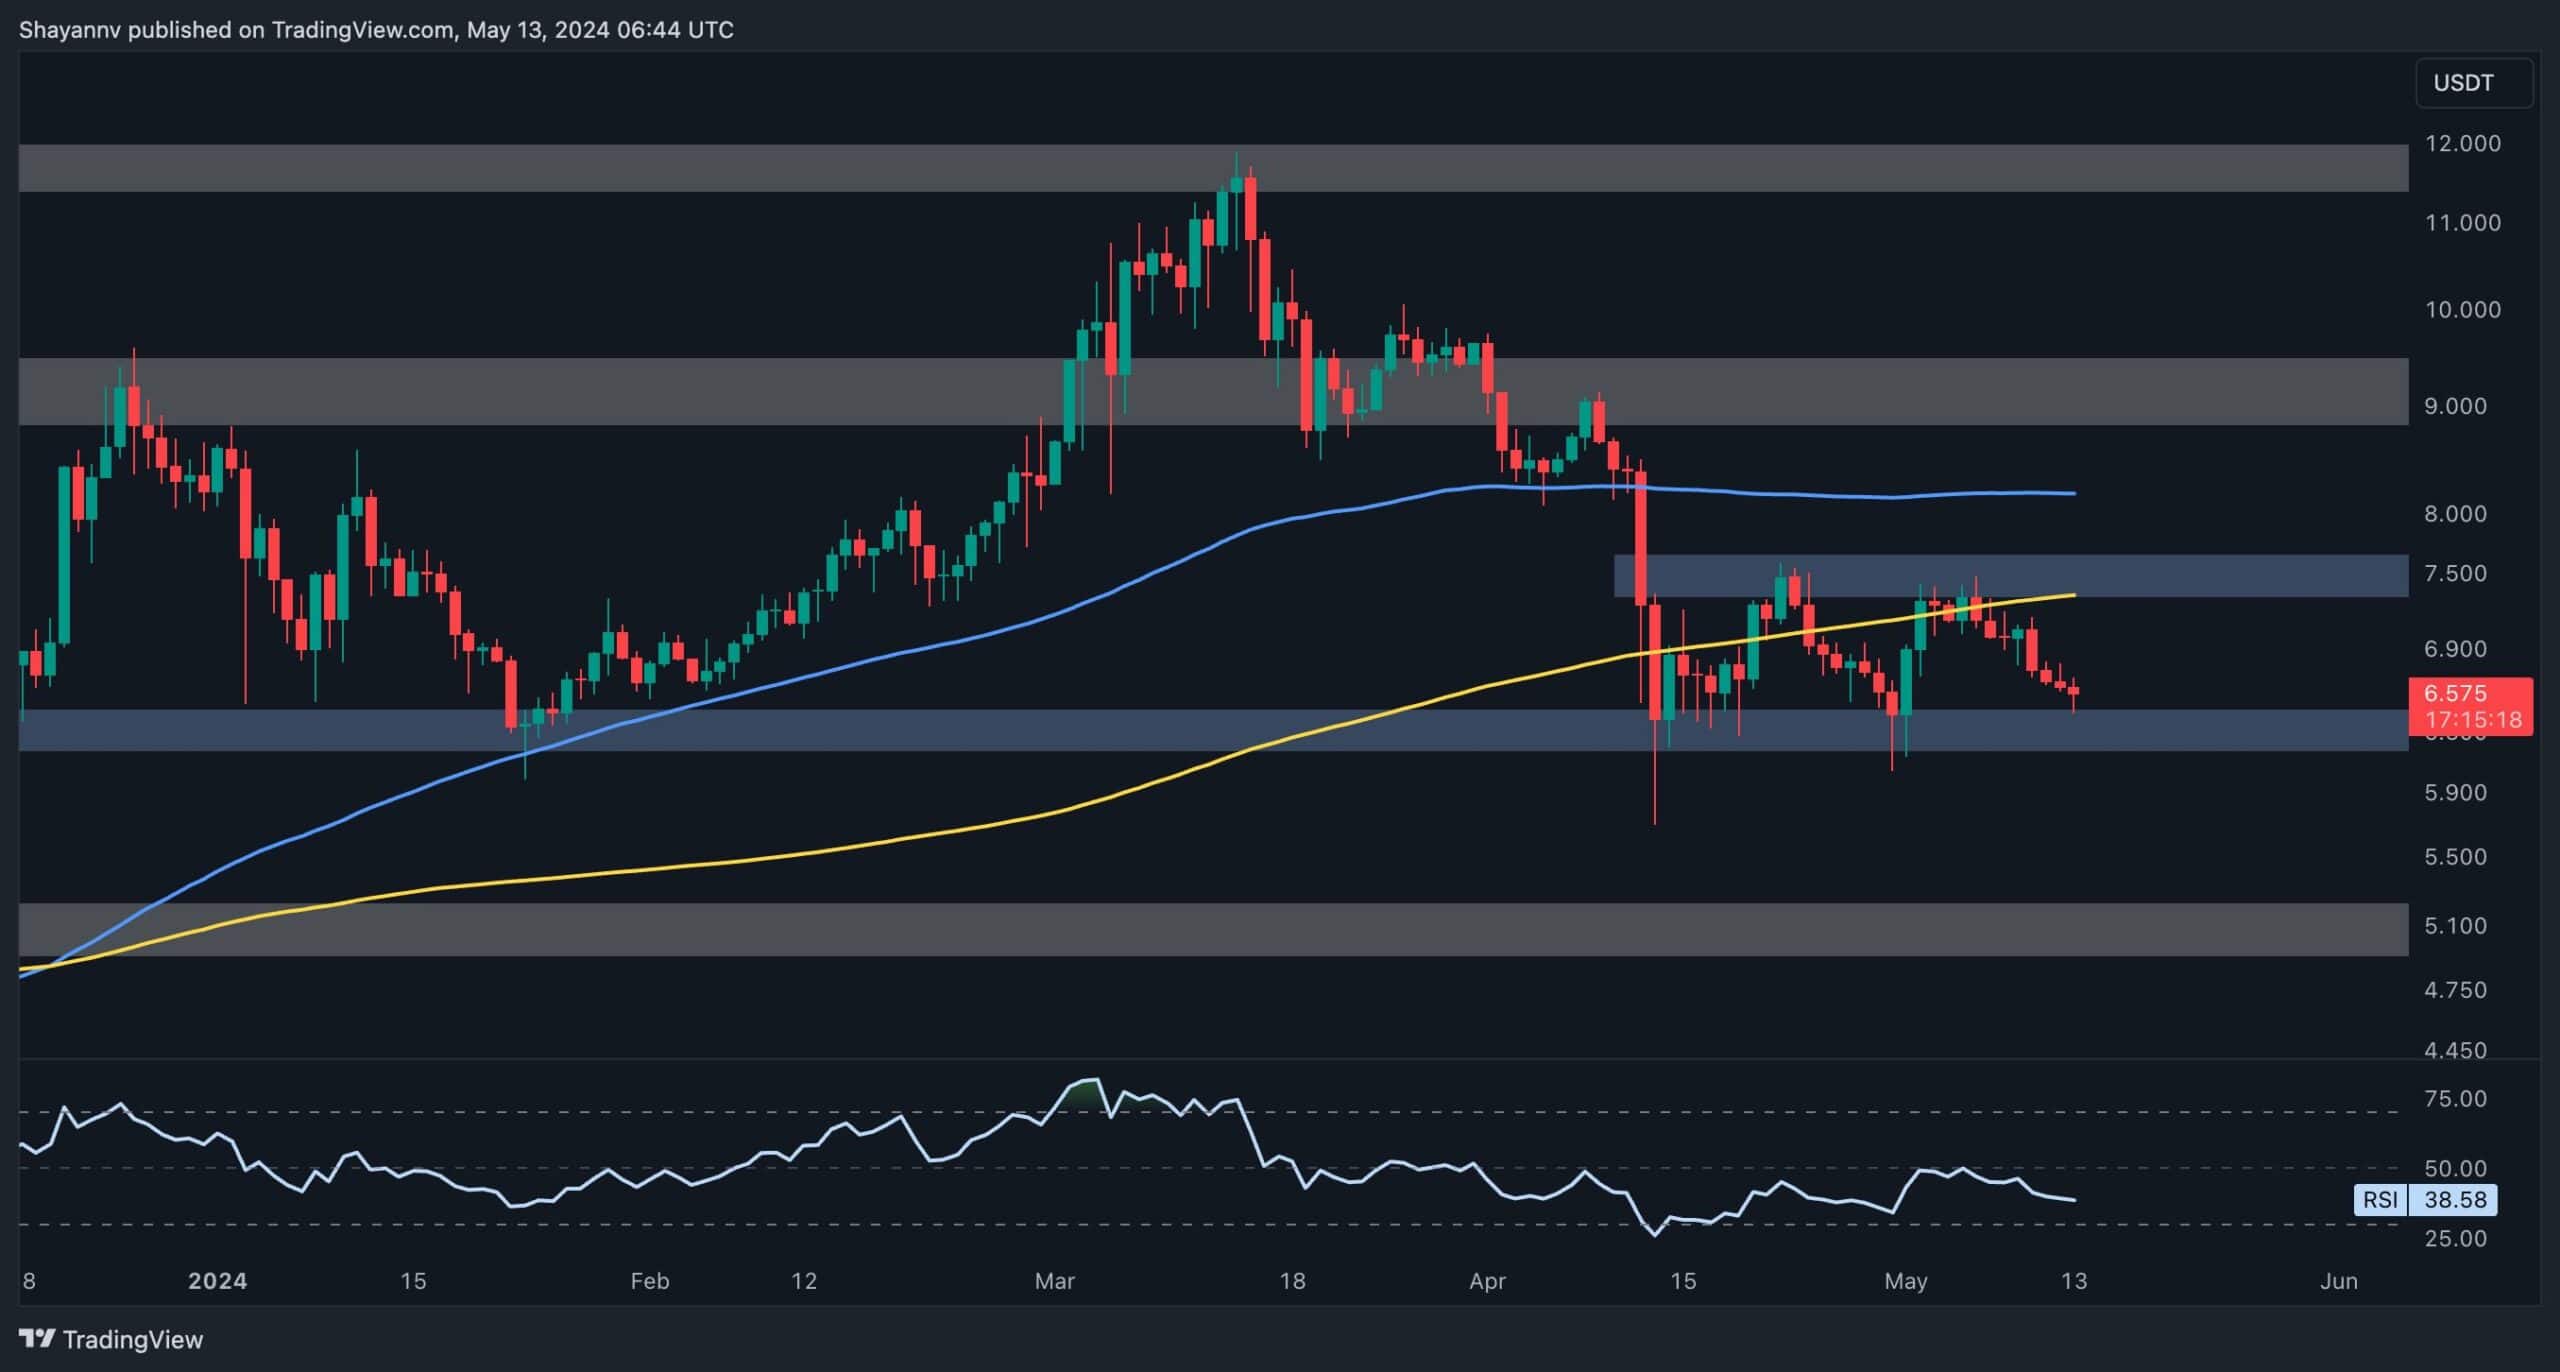
Polkadot recently experienced a significant downturn triggered by increased selling activity around the 200-day moving average, leading it to touch the lower boundary of its sideways trading range.
However, should this boundary be breached unexpectedly, conditions would be ripe for a continuation of the bearish trend.
Technical Analysis
By Shayan
The Daily Chart
Examining Polkadot’s daily chart, we observed a recent bullish ascent culminating at the critical 200-day moving average of $7.4, followed by notable rejection. Subsequently, the cryptocurrency underwent a decline, ultimately landing at a substantial support area represented by the lower threshold of its sideways trading range, positioned at $6.
This lateral movement suggests the likelihood of ongoing consolidation, with a decisive and robust breakout from the $6 to $7.5 price range deemed essential for determining its future trajectory. Nonetheless, a sudden breach of the $6 support zone could initiate a cascading effect, potentially driving prices toward the $5.5 mark.
 Source: TradingView
The 4-Hour Chart
Zooming in on the 4-hour timeframe, Polkadot has exhibited fluctuations within an ascending wedge pattern, bounded by the $6 to $7.5 price range. Most recently, after a brief surge, the price encountered resistance near a critical level, specifically the 0.5 Fibonacci level at $7.5, leading to a noticeable decline.
This suggests the presence of heightened selling pressure around the crucial $7.5 resistance level, indicative of prevalent short positions in the market.
This development raises concerns regarding the continuation of the ongoing bearish trend. If sellers break through the wedge’s lower boundary, it’s more likely that the initial bearish trend will pick up again. On the other hand, if demand strengthens, sideways consolidation will probably continue.
 Source: TradingView
Sentiment Analysis
By Shayan
Polkadot has remained trapped within a consolidation range, facing repeated rejections around the critical $7.5 level. This action has stirred concerns about the future market conditions and the forthcoming direction of its price. The provided Binance DOT/USDT heatmap underscores levels where substantial liquidations might transpire. The probability of a cascading liquidation scenario heightens as the price approaches zones marked in yellow.
As depicted in the chart, significant liquidity pools (highlighted in yellow) loom above the current market price, particularly near the $7.5 and $10 regions. This underscores the intensity of short positions in the perpetual market and identifies potential thresholds for their liquidation. Should the price ascend to these levels, it could trigger a notable liquidation event, leading to a quick downturn.
Nevertheless, sentiment in the futures market presently leans bearish, with expectations leaning towards continuing the downward trend. However, a bullish rebound could spark a substantial short-squeeze event, resulting in a rapid upsurge.
 Source: Coinglass
The post Polkadot Getting Closer to the Danger Zone, Bulls Must Portect This Level: DOT Price Analysis appeared first on CryptoPotato.
.png)
 7 months ago
1


 English (US)