ARTICLE AD BOX
Ripple’s price has been consolidating for the past few months and is yet to show any willingness to either drop or rally.
Ripple Price Analysis
By TradingRage
The USDT Paired Chart
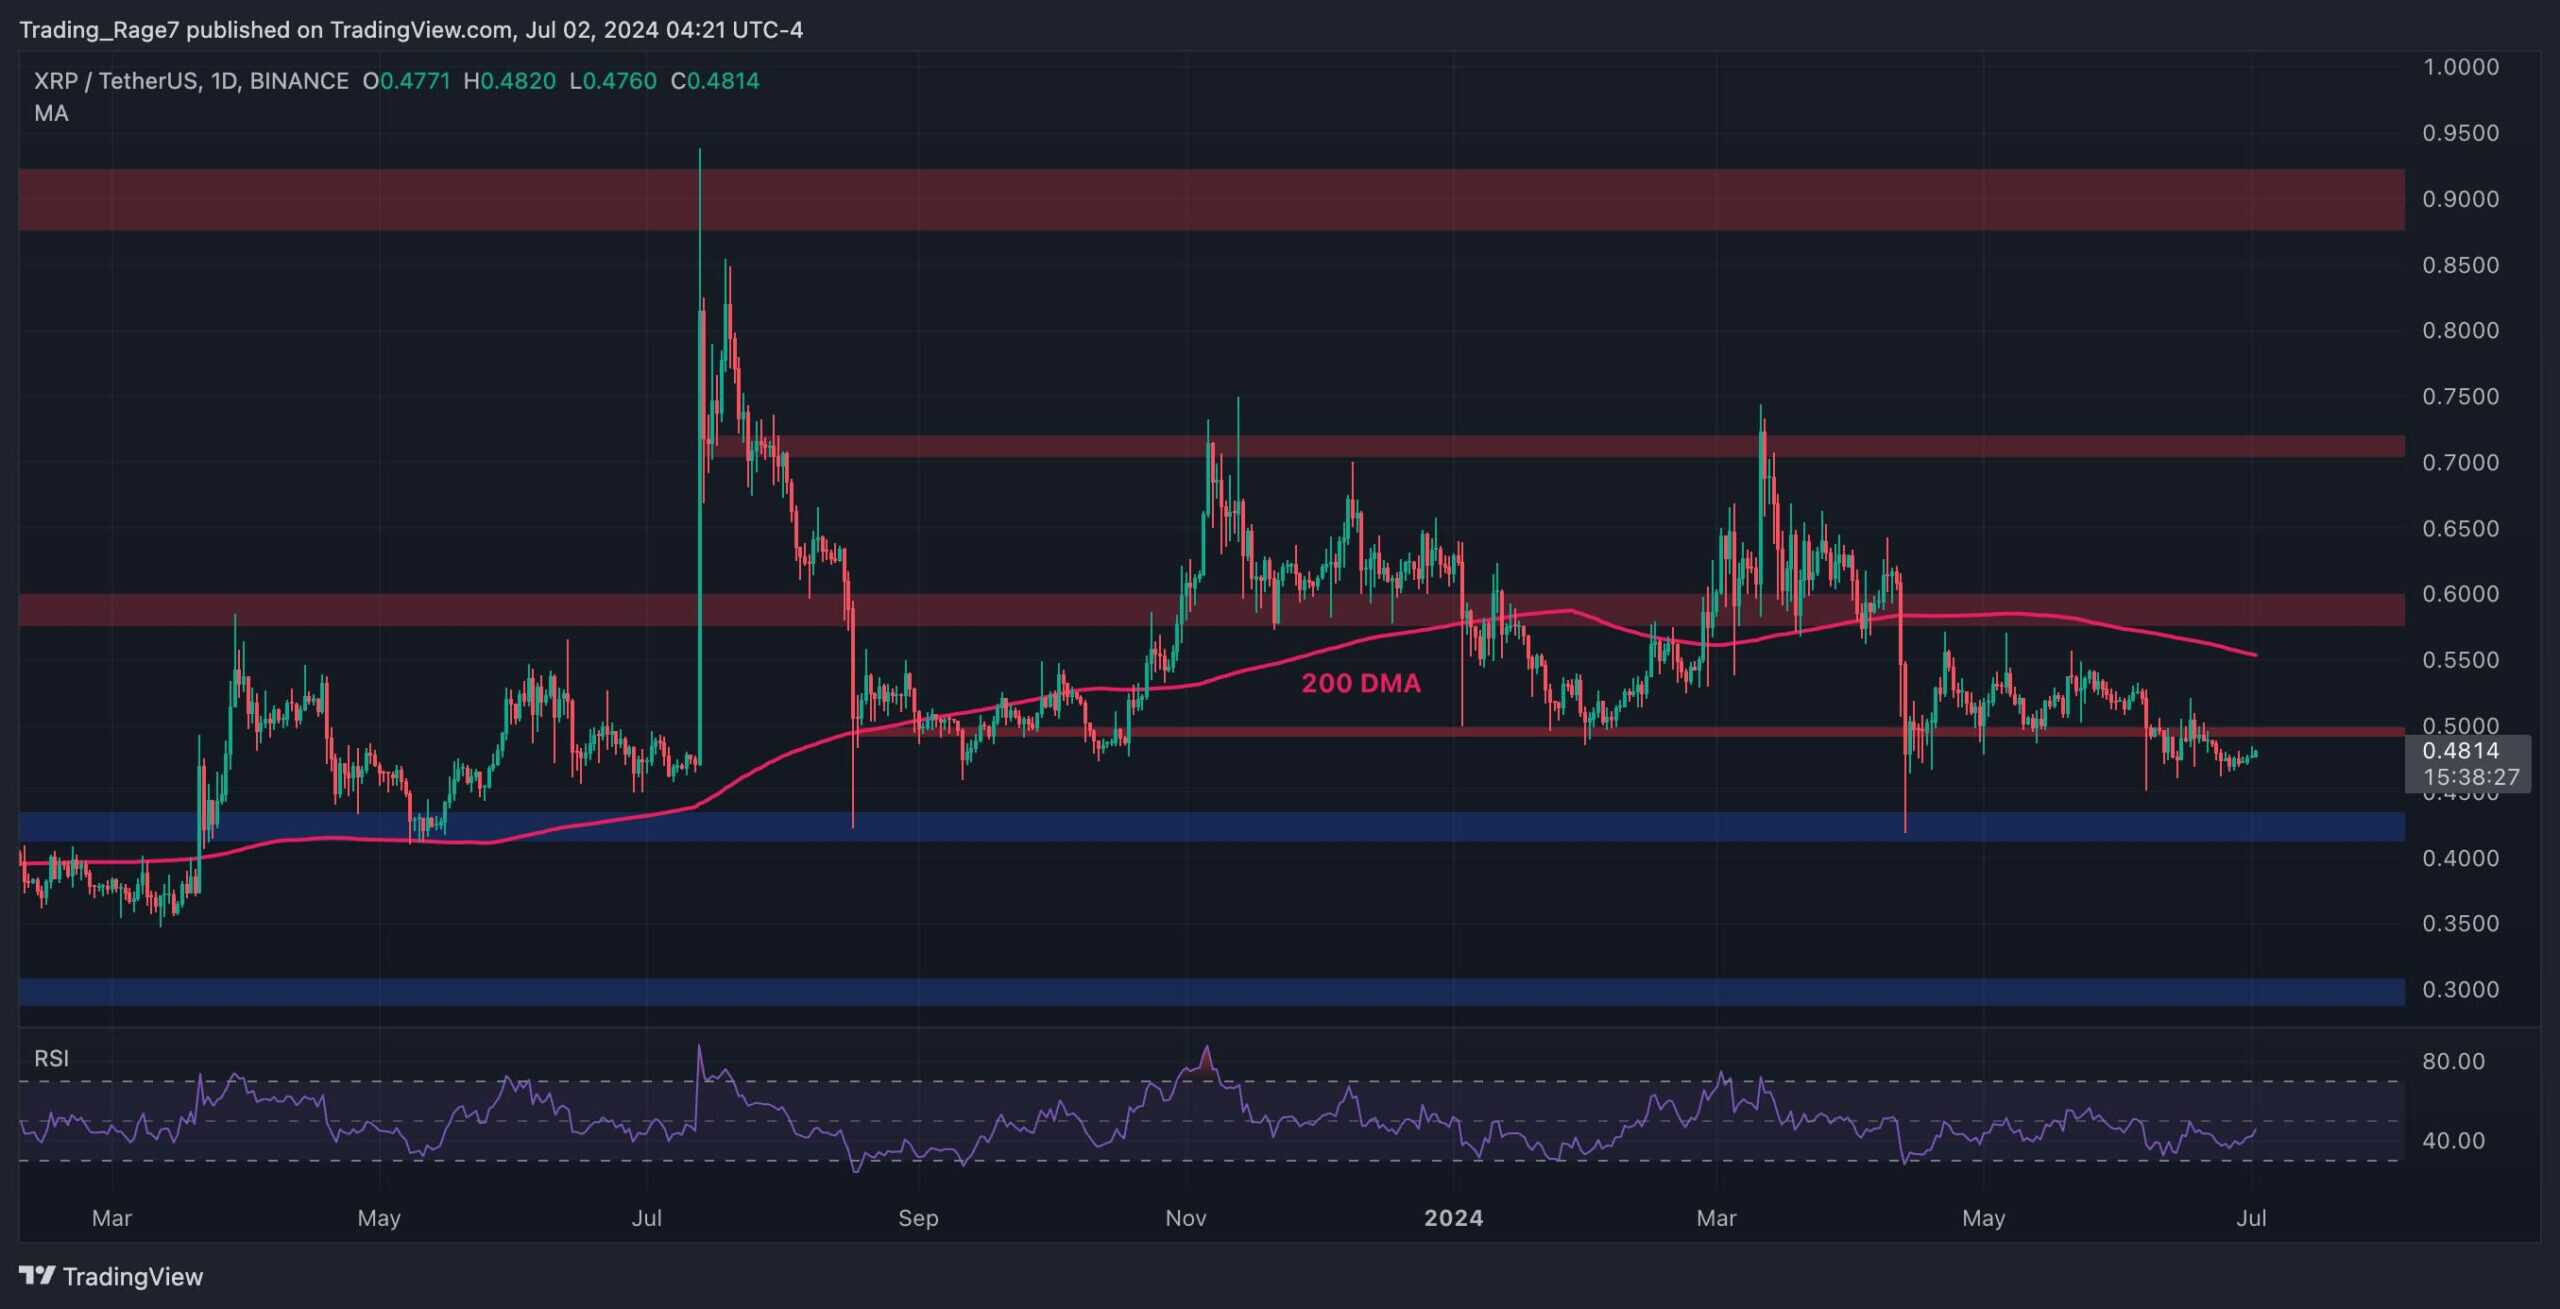
On the USDT pair, Ripple has been range-bound since dropping below the 200-day moving average, which is currently located around the $0.55 mark.
The price has recently broken the $0.5 support level to the downside, and if it is unable to reclaim this level in the coming days, a drop toward the $0.4 support zone would be inevitable.
With the RSI also showing values below 50%, the momentum is in favor of a bearish move.
 Source: TradingView
The BTC Paired Chart
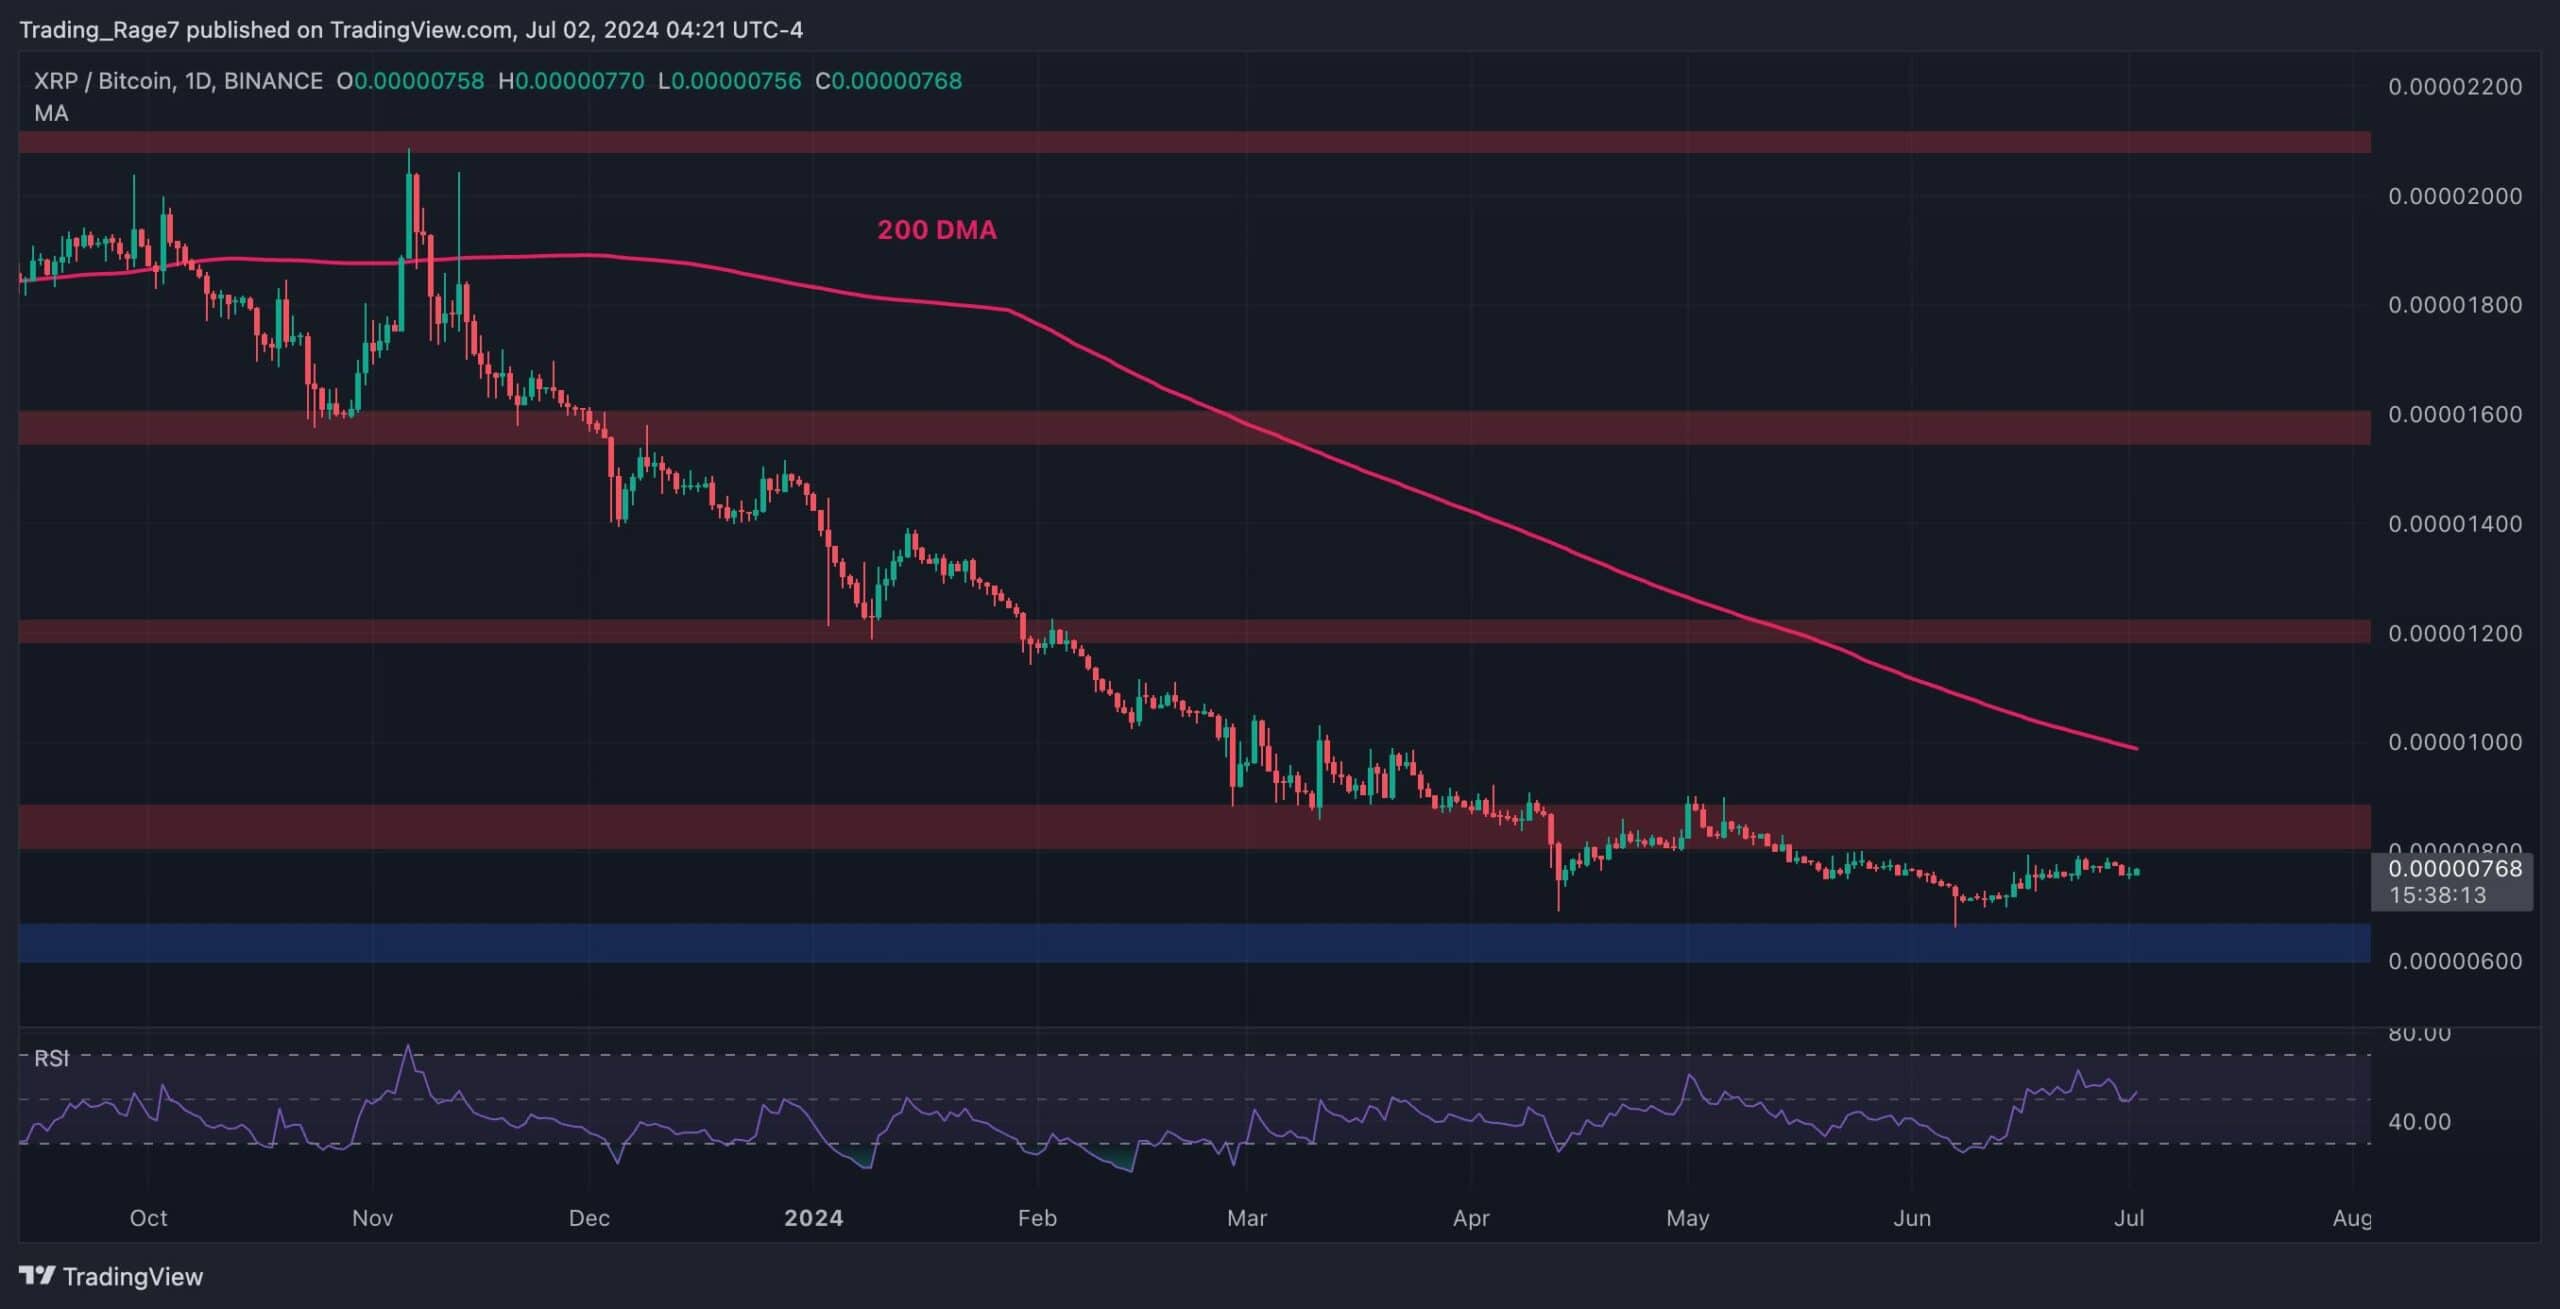
The XRP/BTC chart has also been showing a frustrating period of consolidation over recent months.
The price has failed to rise back above the 800 SAT resistance zone since May and might be bound to test the 600 SAT support level once more in the short term.
Either way, as long as the cryptocurrency remains below the 200-day moving average, which is currently trending around the 1000 SAT mark, a rally against BTC cannot be expected.
 Source: TradingView
The post Ripple Price Analysis: XRP May Be in Danger of Crashing to $0.4 appeared first on CryptoPotato.
.png)
 5 months ago
2


 English (US)