ARTICLE AD BOX
Ripple (XRP) could be on track for a return to $1 after a recent evaluation highlighted a familiar pattern. This pattern previously led to breakouts in 2017 and 2021. Currently, XRP is trading at $0.53.
The cryptocurrency market now waits to see if XRP can break the critical psychological barrier. Will it succeed? All eyes are on its next move.
Historical Trends Suggest Major Ripple Rally
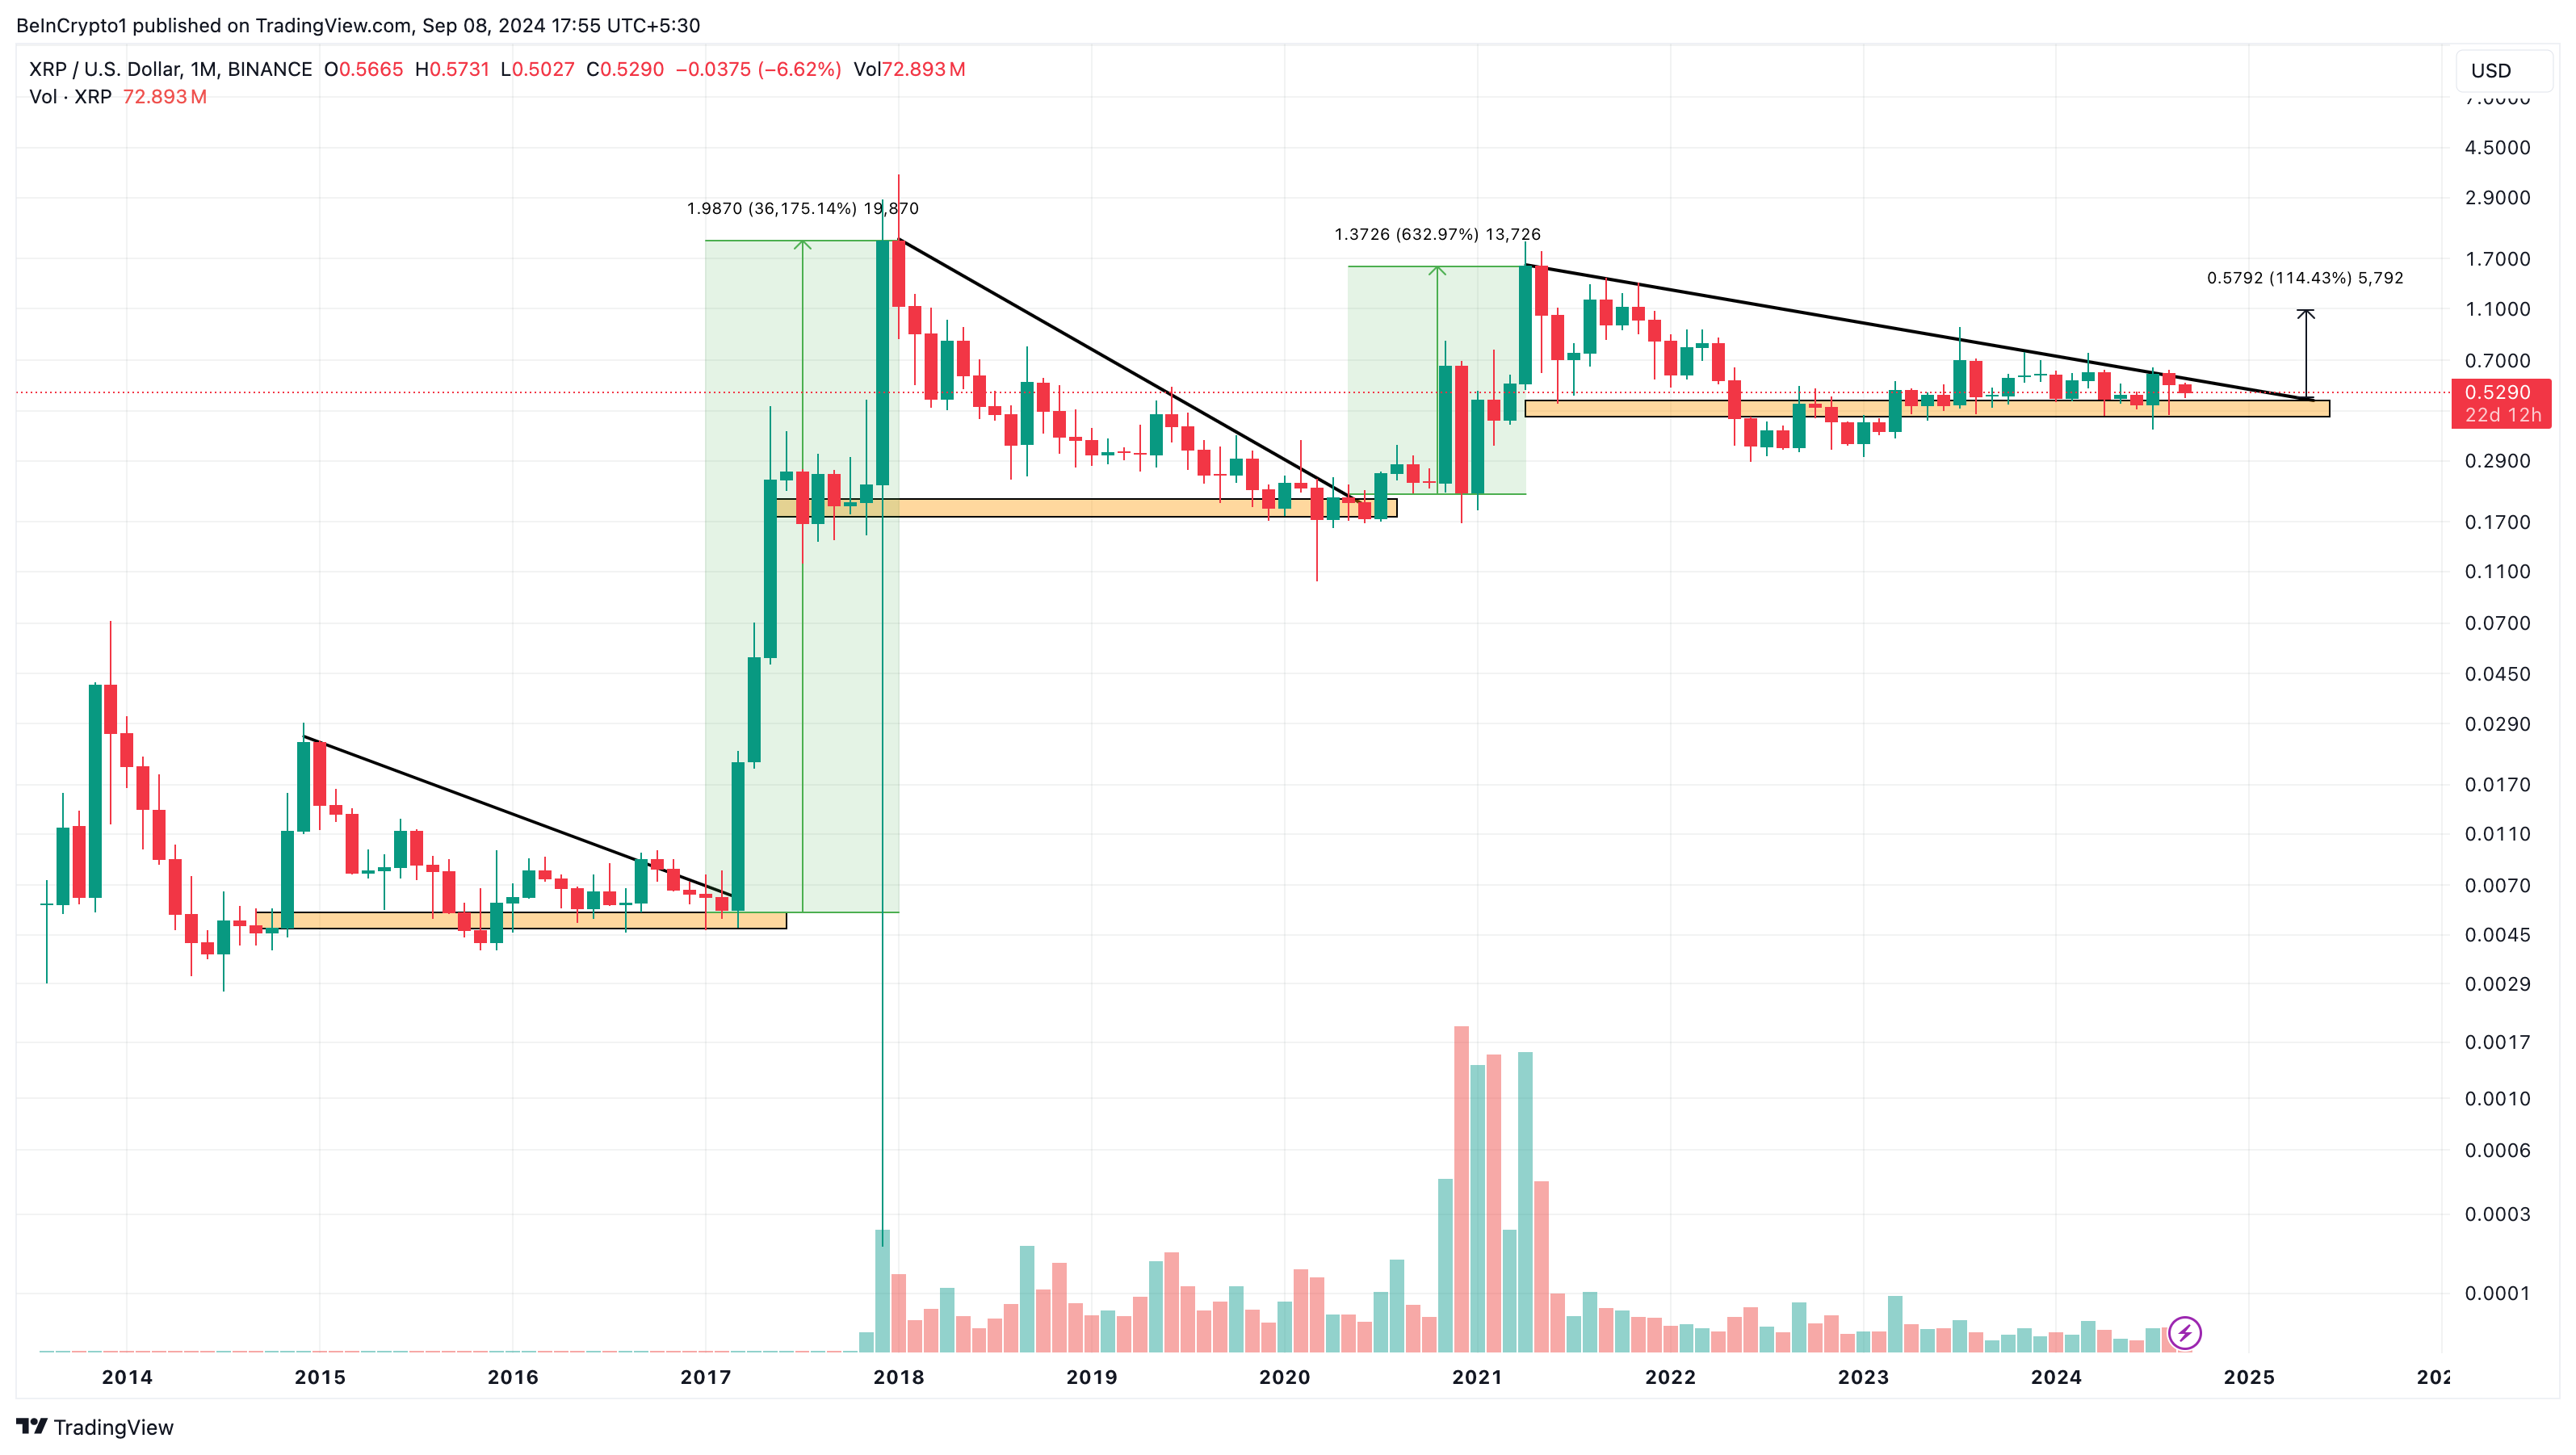
According to the monthly XRP/USD chart, the altcoin experienced successful breakouts during the 2017 and 2021 bull markets after breaking out of a descending triangle. In March 2017, XRP’s price dropped to $0.0062 and formed a descending triangle on the chart. After a bullish engulfing candle broke out of the pattern, XRP rallied to $0.020, marking the start of its surge above $2 by December of that cycle.
A similar pattern occurred during the last bull market, with XRP rising from $0.15 to $1.55 between July 2020 and April 2021. This time, XRP seems poised to replicate this performance. The cryptocurrency shows strong support between $0.43 and $0.48, though a green candlestick has yet to confirm the breakout.
Read more: 8 Best Crypto Leverage Trading Platforms in 2024
 XRP Monthly Analysis. Source: TradingView
However, as the drums of the bull market continuation hit harder, there is a chance that the altcoin will validate the move. If this happens, XRP’s price might increase by 114%, which could take it to $1.08 from its current level.
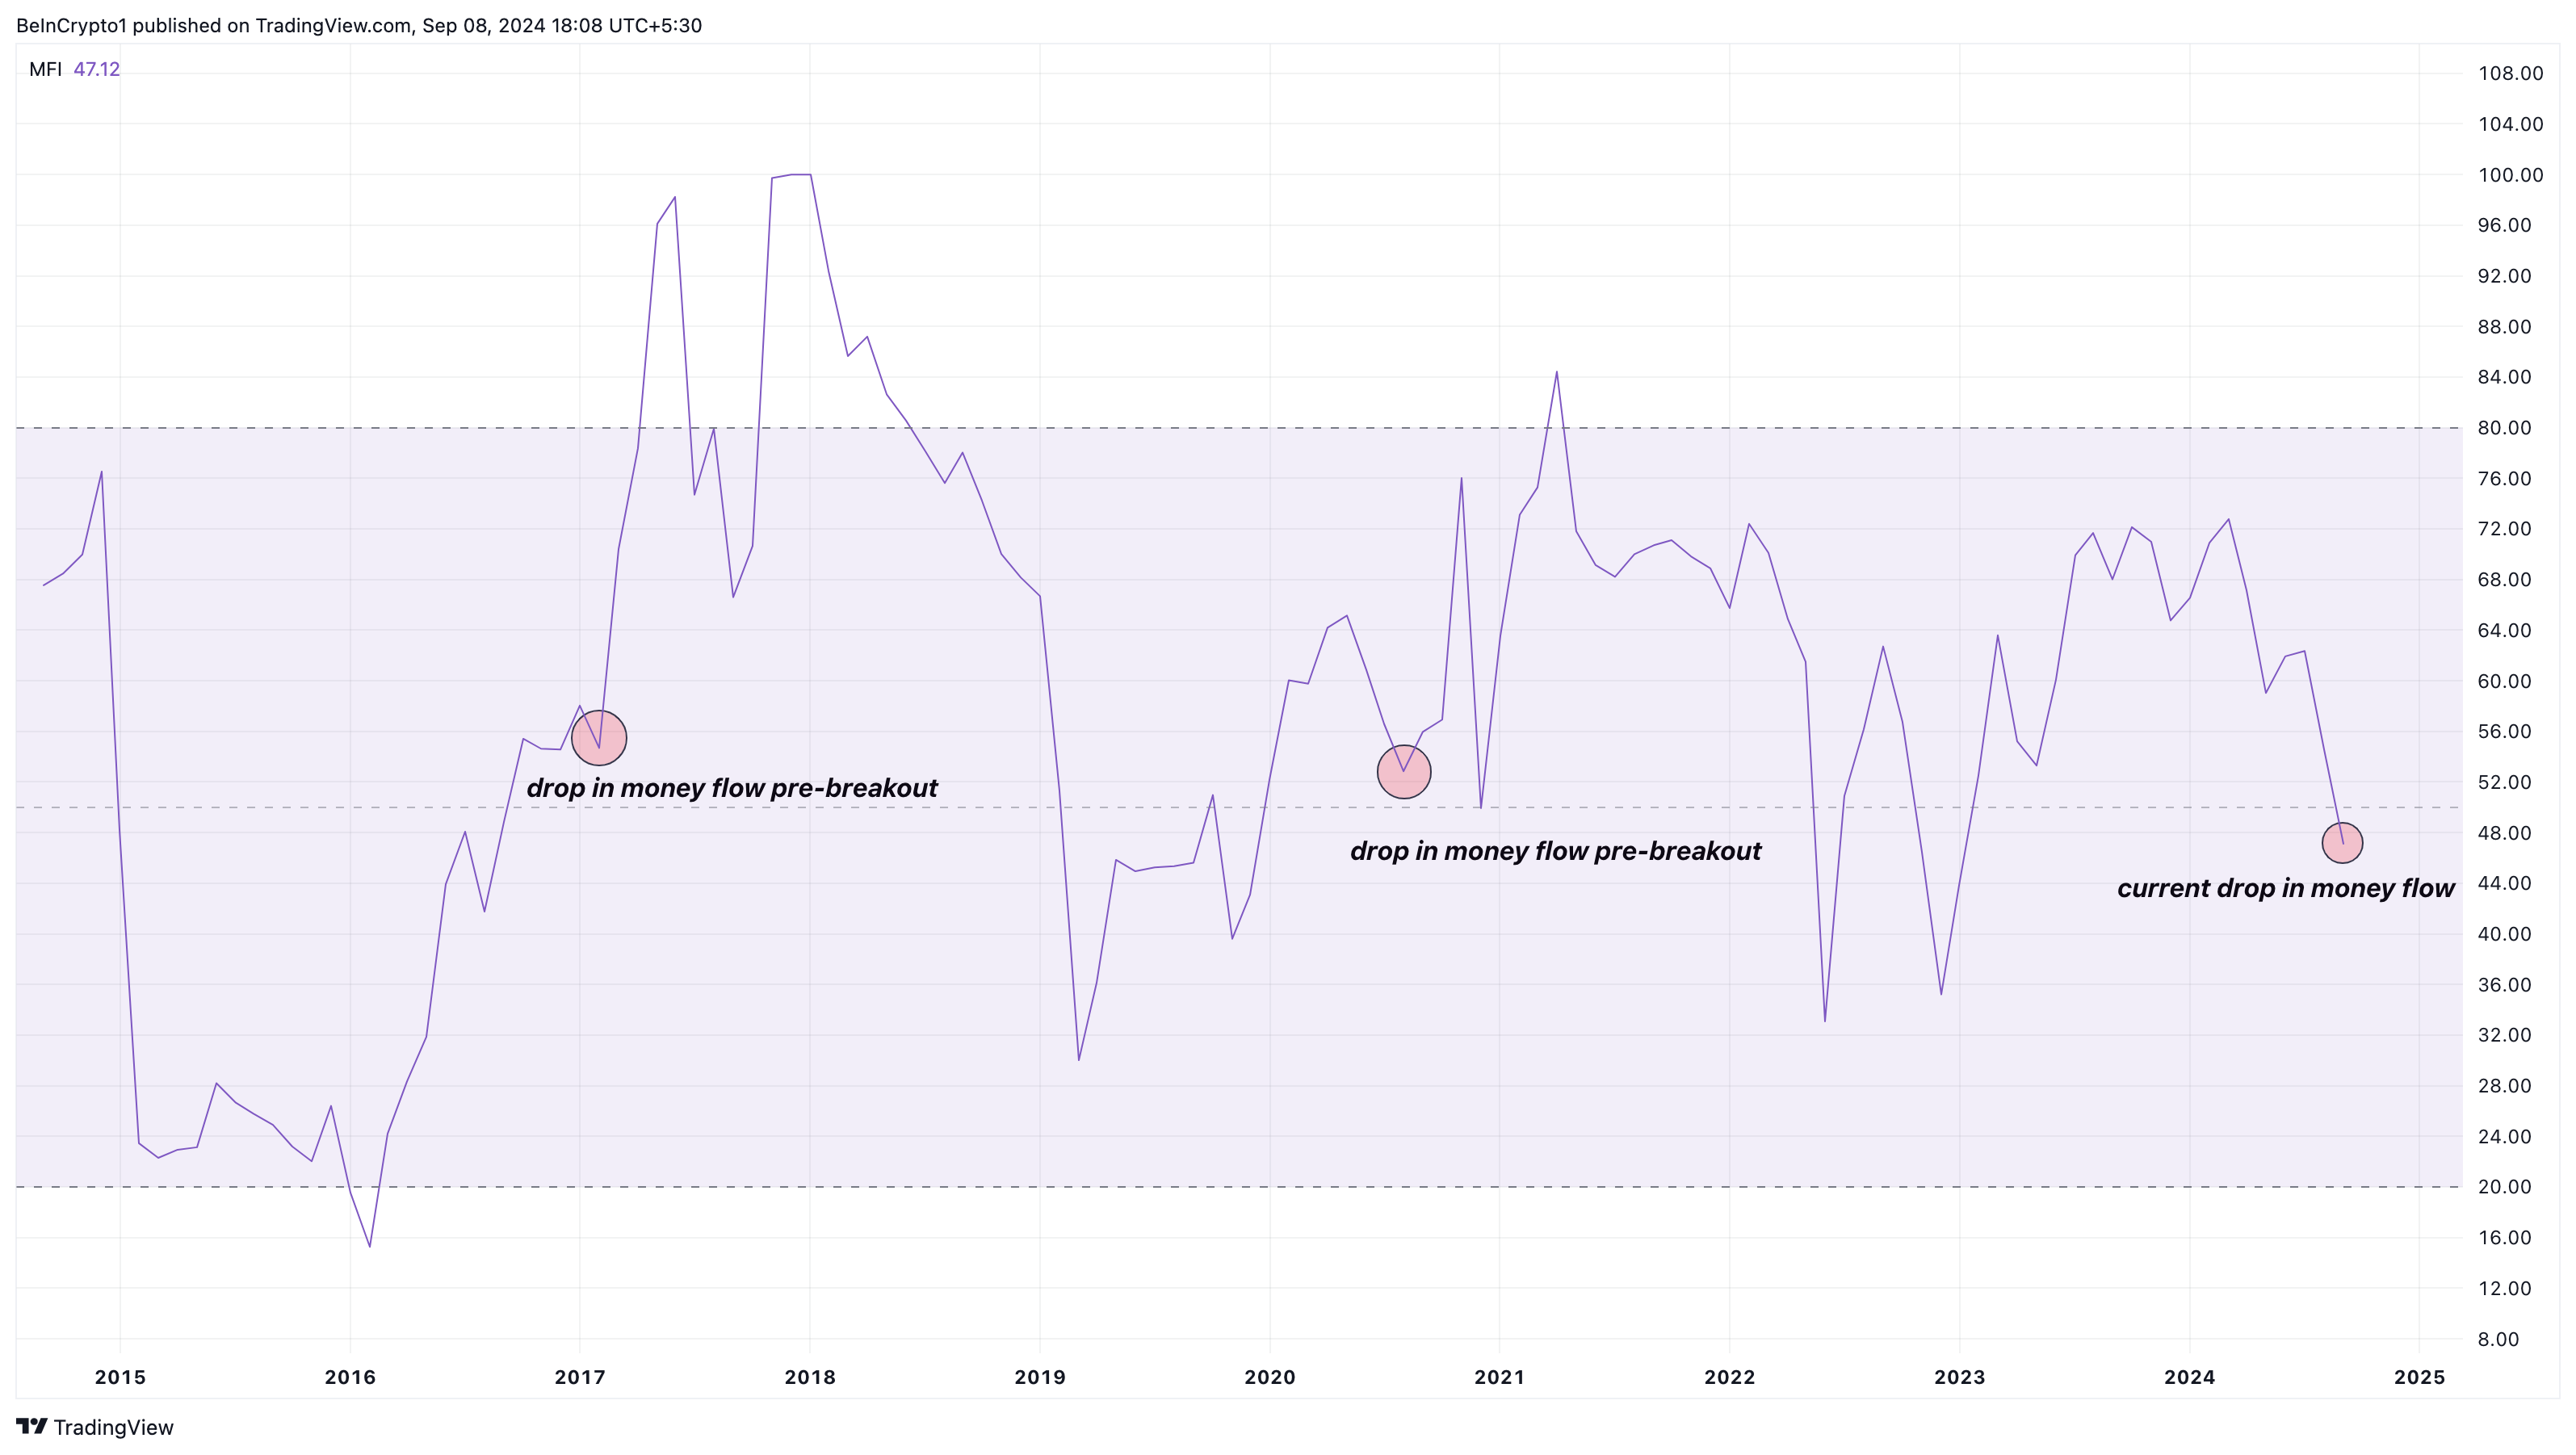
It is also important to mention the trend displayed by the Money Flow Index (MFI). Taking it back to 2017, the MFI reading tanked significantly before the upswing. In 2020, the technical indicator repeated an almost identical trend before the big move above $1.
Currently, the MFI appears to be leaning toward the trend. If validated, XRP’s price could swing toward or above the $1 mark within a few months.
 XRP Money Flow Index. Source: TradingView
 XRP Price Prediction: Before $1, the Altcoin Might Take $0.58
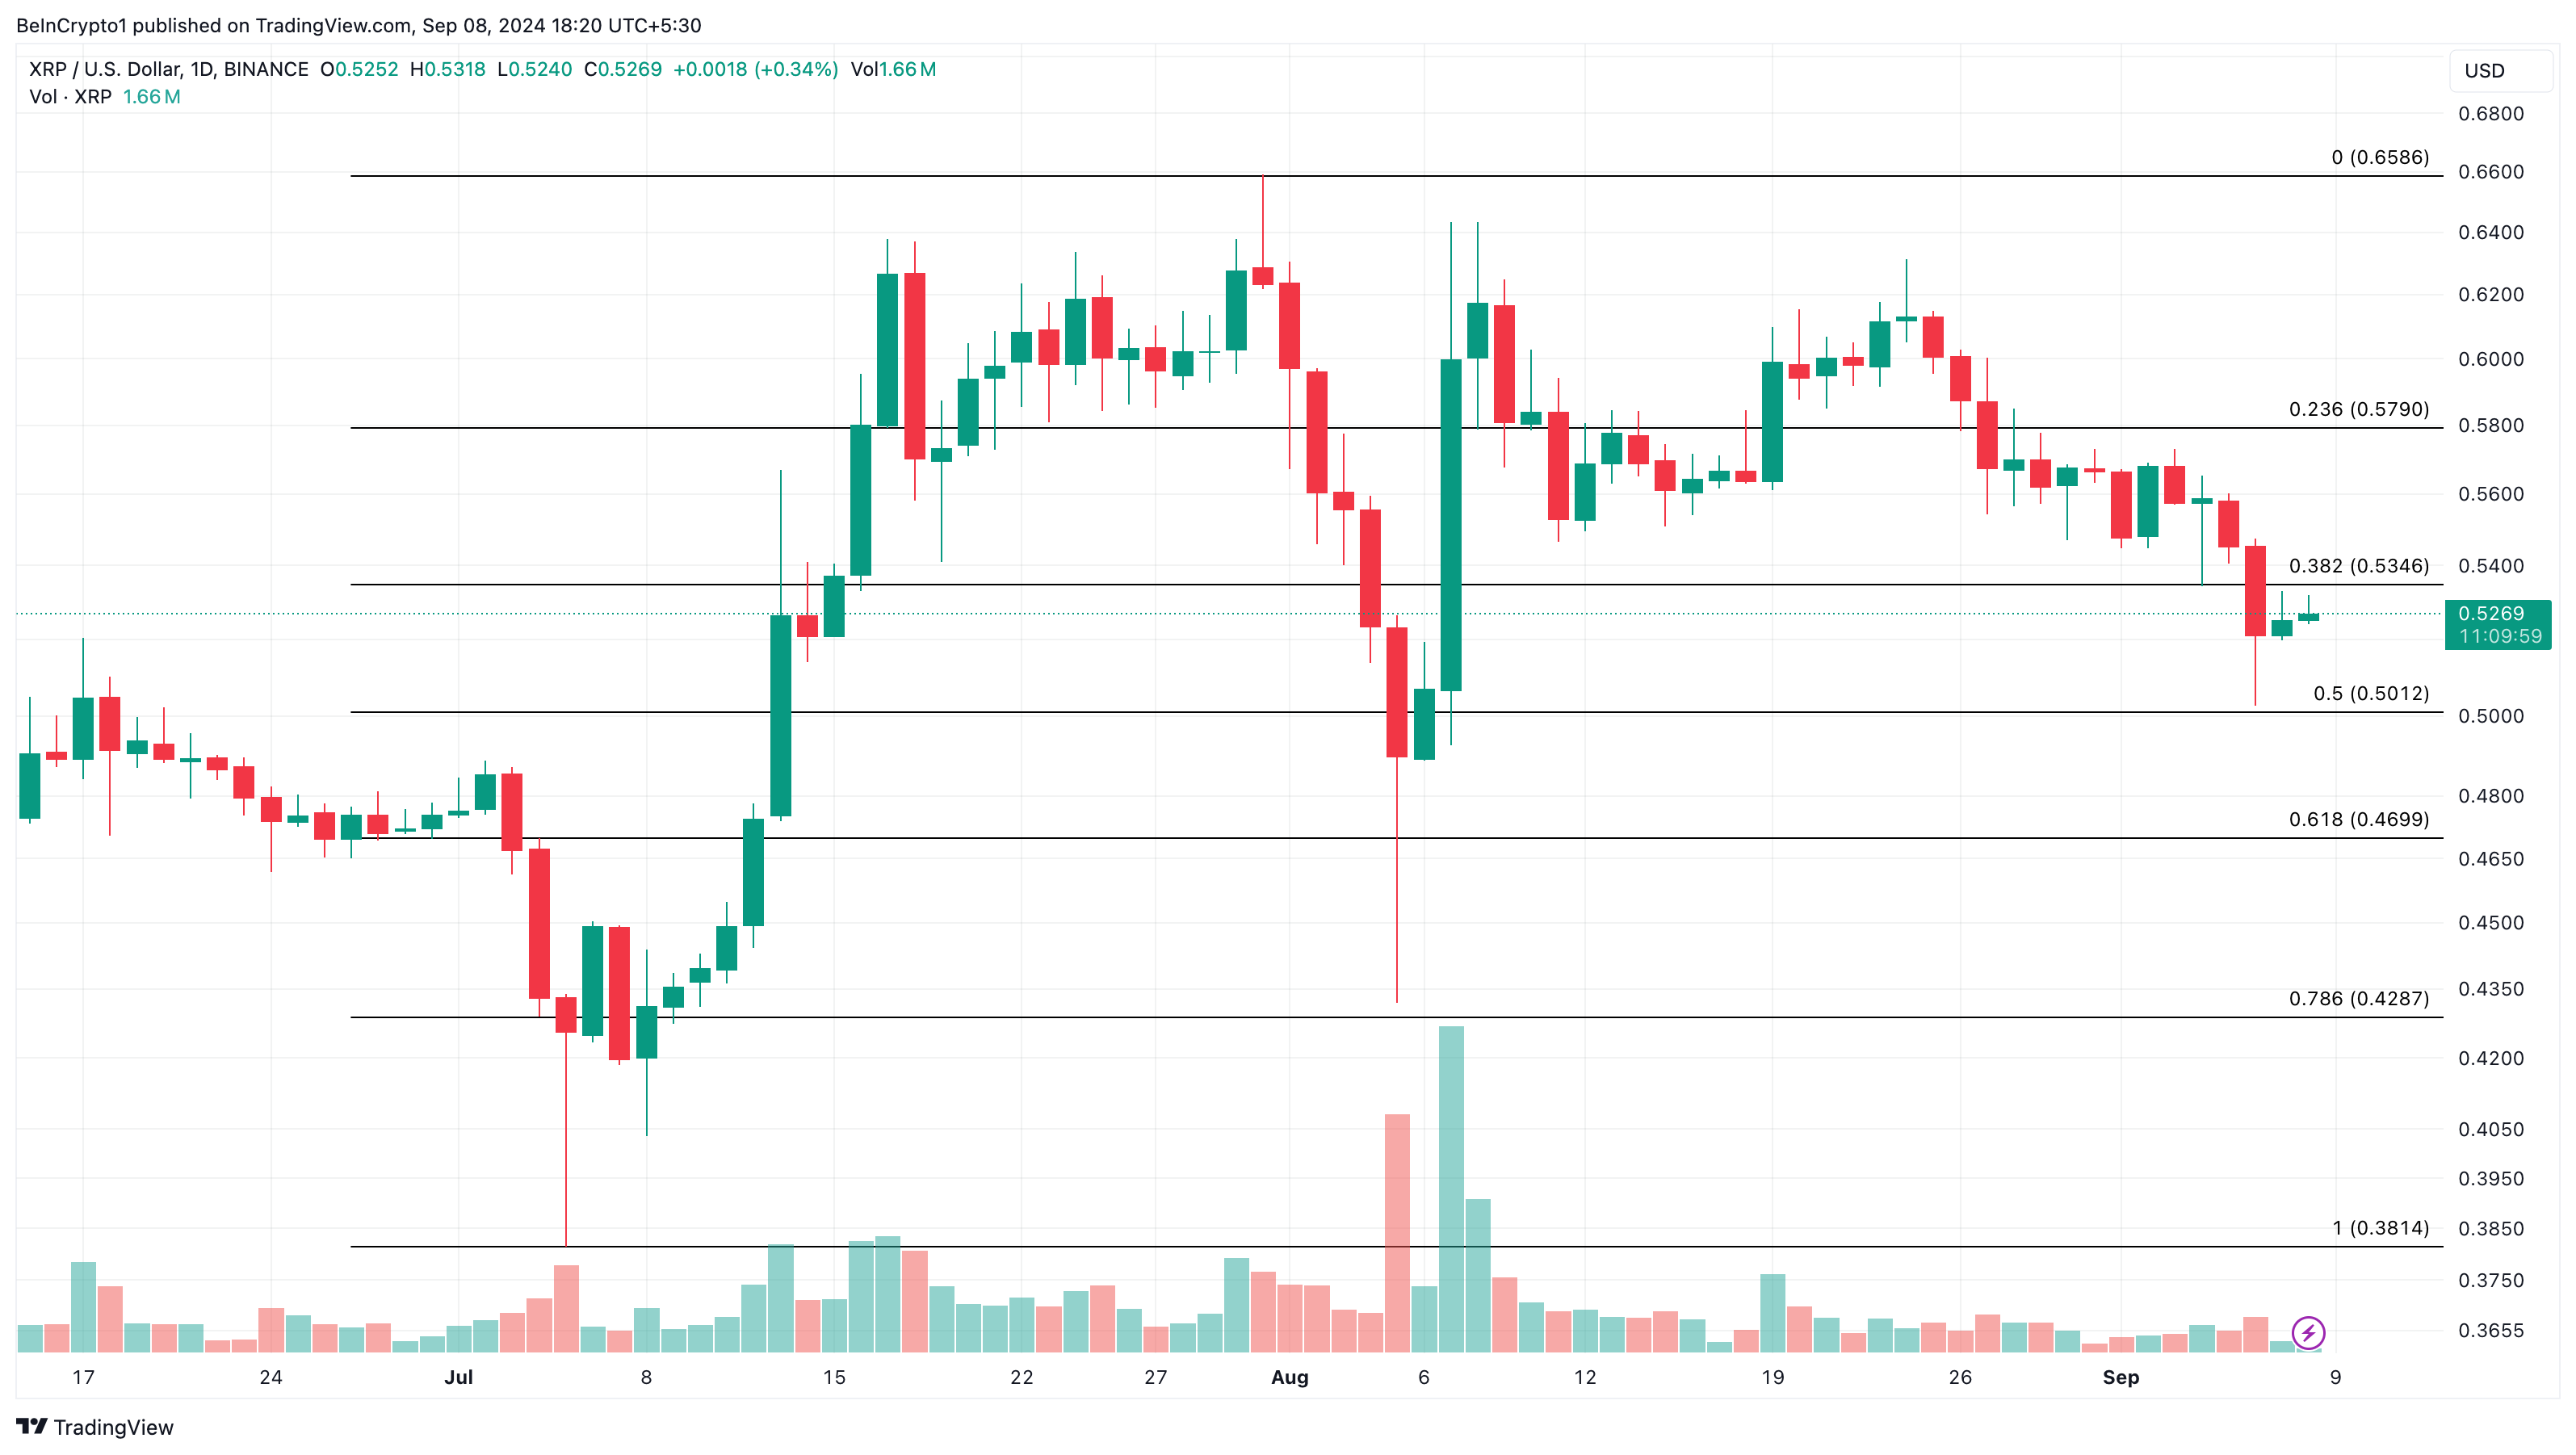
In the meantime, the altcoin has avoided dropping to $0.50 again. If that had happened, then XRP’s price could have crashed to $0.46 could have taken place.
However, according to the daily chart, bulls still have a lot of work to do. First, the altcoin’s value needs to reclaim the 38.2% Fibonacci ratio at $0.53 to increase its chances of hitting a higher value.
Once this occurs and buying pressure increases, the cryptocurrency’s next stop might be around $0.58.
Read more: Ripple (XRP) Price Prediction 2024/2025/2030
 XRP Daily Analysis. Source: TradingView
 Still, traders should remain cautious of key market changes. If XRP fails to break through the resistance at $0.53, the price will likely retreat to $0.50.
The post Ripple (XRP) Price Targets $1 Breakout as Monthly Chart Unveils Bullish Pattern appeared first on BeInCrypto.
.png)
 4 months ago
5


 English (US)