ARTICLE AD BOX
Bitcoin has once again surged impulsively, defying several bearish signals hinting at a potential correction phase.
Despite these warnings, the price has broken through a significant resistance level that has persisted over multiple months, signaling a strong presence of buyers in the market and the potential for the continuation of the current trend.
Technical Analysis
By Shayan
The Daily Chart
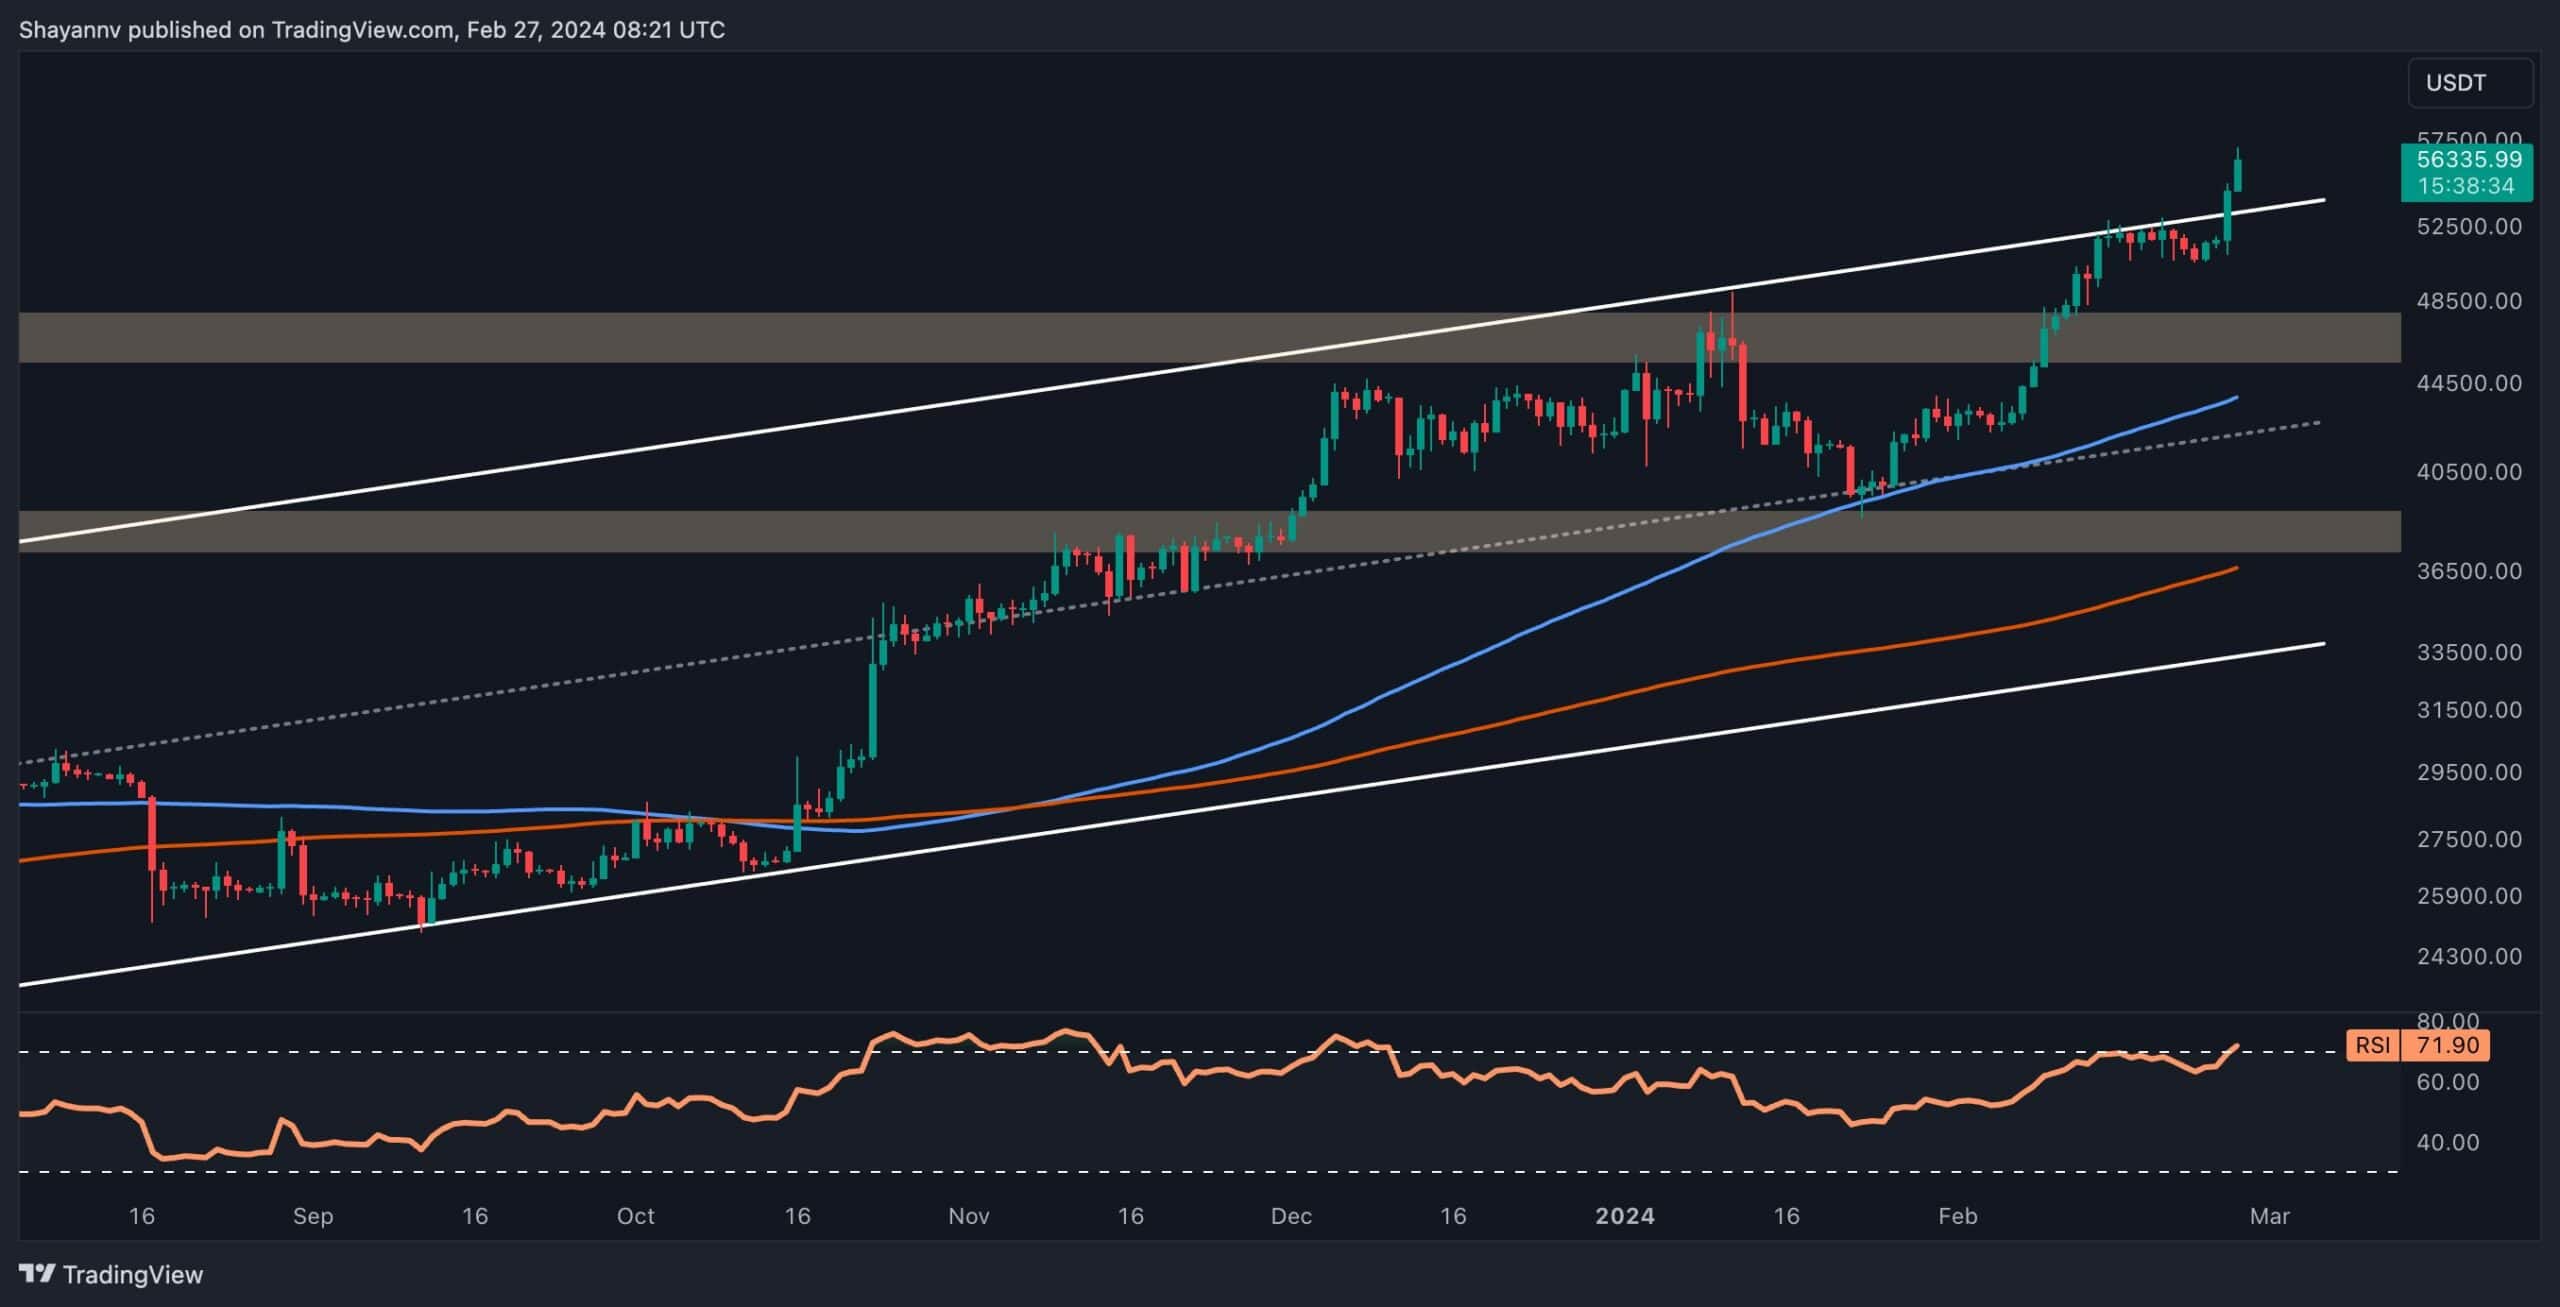
A deep dive into the daily chart underscores Bitcoin’s sustained bullish trend, showcasing the prevailing dominance of buyers. Recent price movements reflect robust confidence among market participants, propelling the cryptocurrency past numerous critical and psychological resistance levels.
Notably, heightened buying pressure and strong bullish momentum have propelled the price above the upper boundary of the multi-month ascending channel, previously a formidable barrier to bullish advances.
This breakthrough triggered a short-squeeze event, activating a cascade of buy-stop orders. Consequently, should a pullback occur towards the breached trendline, the price is anticipated to extend its bullish momentum, targeting the significant $58K resistance zone.
 Source: TradingView
The 4-Hour Chart
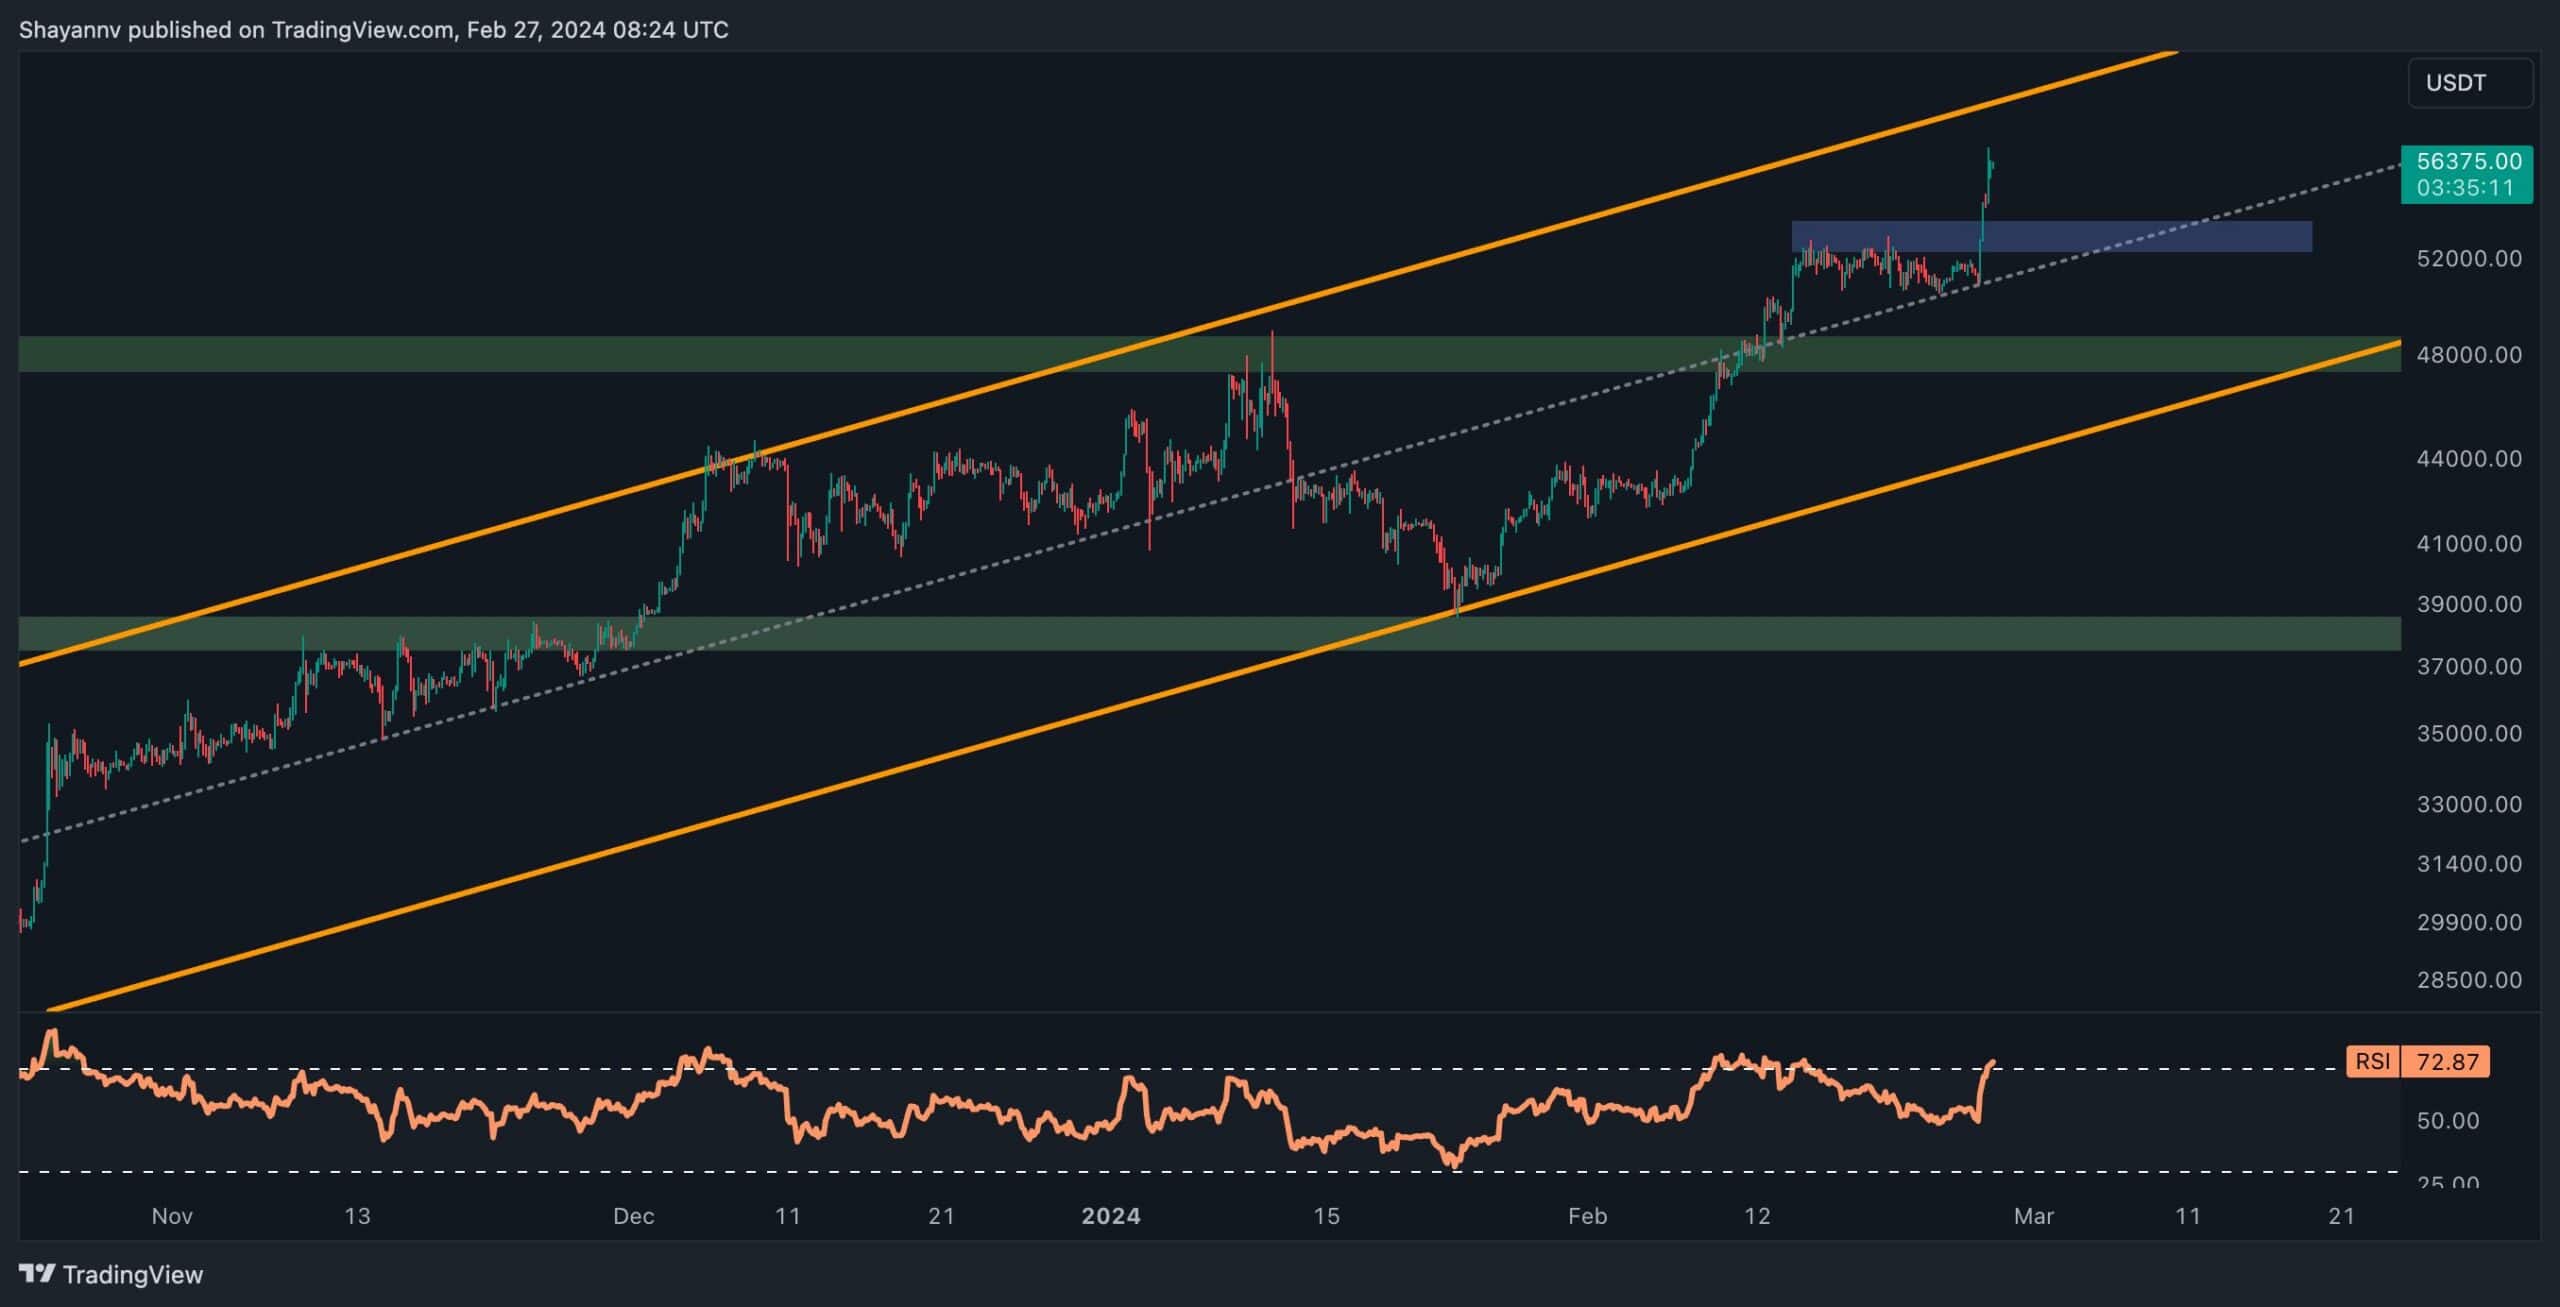
Examining the 4-hour chart, a period of subdued price action can be observed near the key $52K resistance level, followed by a sudden surge in bullish momentum that breached this barrier decisively. This rapid ascent indicates a prevailing bullish sentiment among market participants, with many anticipating further increases in Bitcoin’s value throughout 2024.
However, caution is warranted as the price approaches the upper boundary of the ascending multi-month channel in the 4-hour timeframe, serving as a critical barrier for Bitcoin buyers. Given the recent acceleration in bullish momentum, a minor correction appears probable in the short term, potentially leading to a pullback towards the $52K level.
Overall, the current outlook for Bitcoin remains bullish, with the possibility of minor corrections notwithstanding.
 Source: TradingView
On-chain Analysis
By Shayan
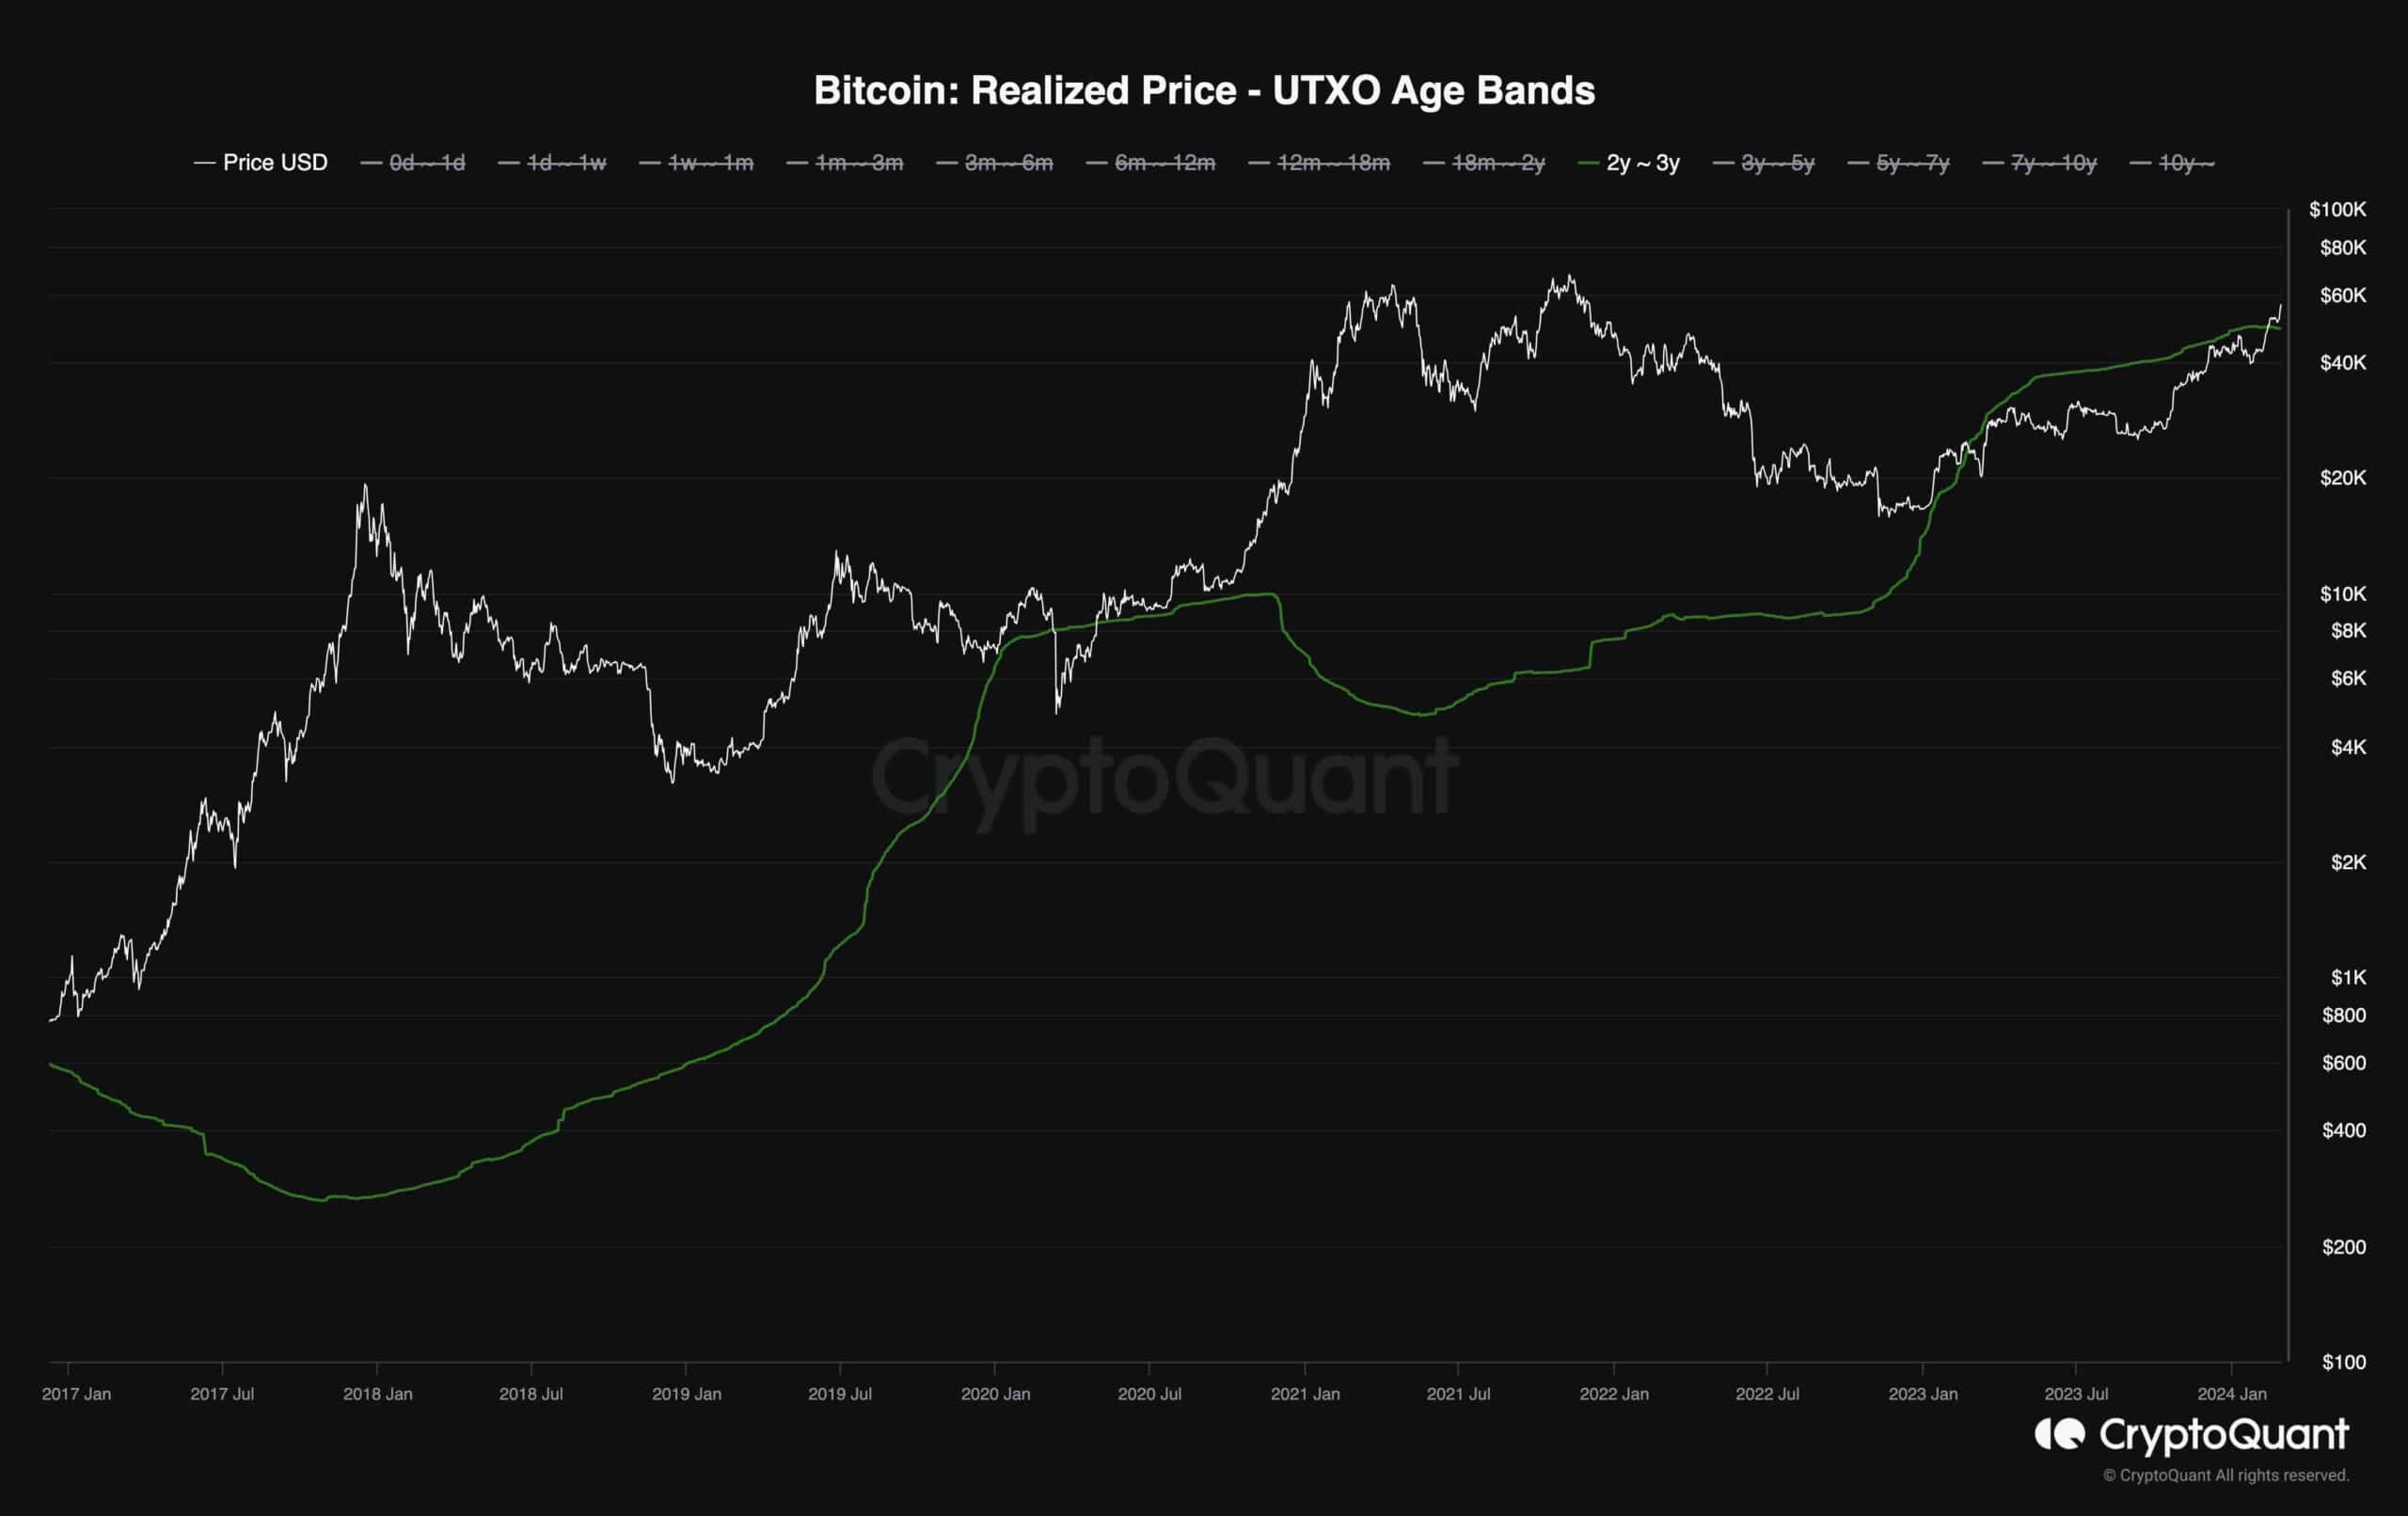
This chart demonstrates the Realized Price – UTXO Age Bands indicator, which offers valuable insights into the average buying price based on BTC holding periods.
Recent data from this indicator reveals that the average buying price of cohorts that invested during the last cycle’s bull rally has notably surpassed previous levels, particularly among 2-3-year holders whose average buying price sits at $48.8K. Interestingly, this cohort also holds the largest share of the Realized Cap (%) at 24%.
In essence, investors who began holding during the previous cycle’s bull rally, particularly those in the 2-3-year bracket, established a significant resistance price level. However, with Bitcoin’s price surging to $57K, it appears that the only remaining resistance level ahead is the peak of the last cycle at $70K.
Looking ahead, the buying pressure from US institutional investors is anticipated to strengthen further, particularly with the introduction of spot Bitcoin ETFs. Even if there’s a market downturn triggered by unforeseen macroeconomic or cryptocurrency-specific factors, Bitcoin’s resilience suggests that any price crash is likely to be temporary, akin to the recoil of a compressed spring.
 Source: CryptoQuant
The post The Reasons Behind Bitcoin’s Surge to $57K and is a God Candle Coming? (BTC Price Analysis) appeared first on CryptoPotato.
.png)
 9 months ago
2


 English (US)