ARTICLE AD BOX
The Bitcoin (BTC) price and the Crypto Market Cap (TOTALCAP) fell during the weekend. Arweave (AR) failed to sustain a long-term breakout.
In the news today:
- A DAO dedicated to Web3 security successfully recovered 36 Bored Ape Yacht Club (BAYC) and 18 Mutant Ape Yacht Club (MAYC) NFTs.
- Solana Saga phones have been listed on eBay for $5,403, creating a frenzy as the demand grows.
TOTALCAP Returns to Support
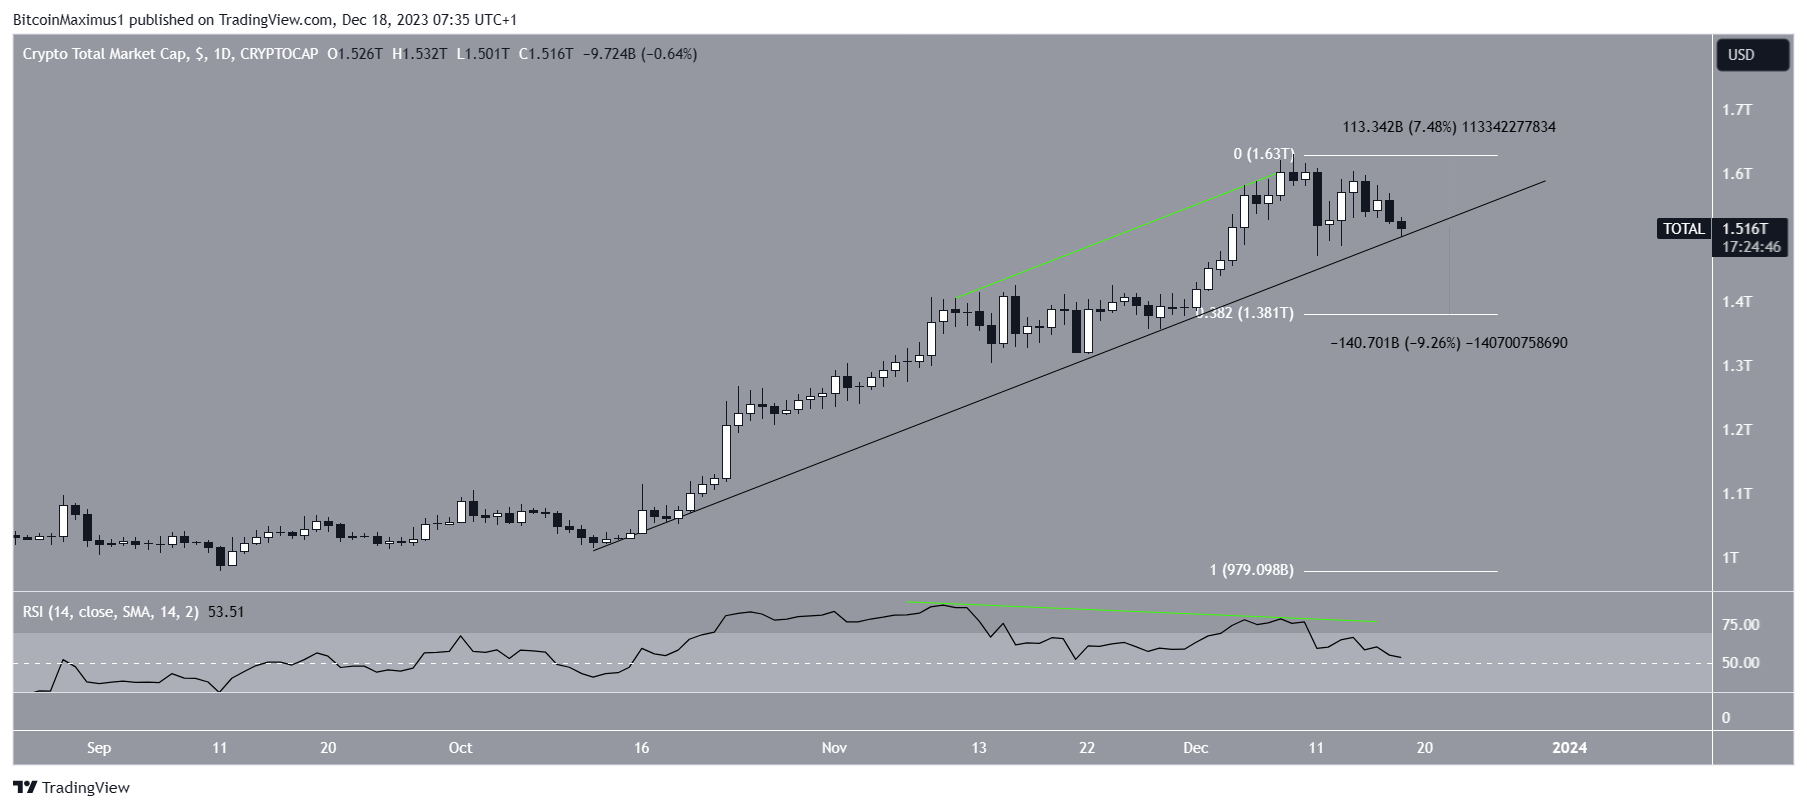
The cryptocurrency market cap has increased alongside an ascending support trend line since October. The upward movement led to a new yearly high of $1.63 trillion on December 9.
Market traders use the RSI as a momentum indicator to identify overbought or oversold conditions and to decide whether to accumulate or sell an asset. Readings above 50 and an upward trend indicate that bulls still have an advantage, whereas readings below 50 suggest the opposite.
The decrease was preceded by a bearish divergence (green) in the daily RSI. A bearish divergence occurs when a momentum decrease accompanies a price increase. It often leads to bearish reversals, as was the case with TOTALCAP.
The TOTALCAP reached the ascending support trend line today. If TOTALCAP breaks down from the ascending support trend line, it can fall by another 9% to the 0.382 Fib retracement support level at $1.38 trillion.
 TOTALCAP Daily Chart. Source: TradingView
Despite this bearish TOTALCAP price prediction, a strong bounce at the ascending support trend line can cause a 7% increase to the yearly high at $1.63 trillion.
Bitcoin Falls Below Support Trend Line
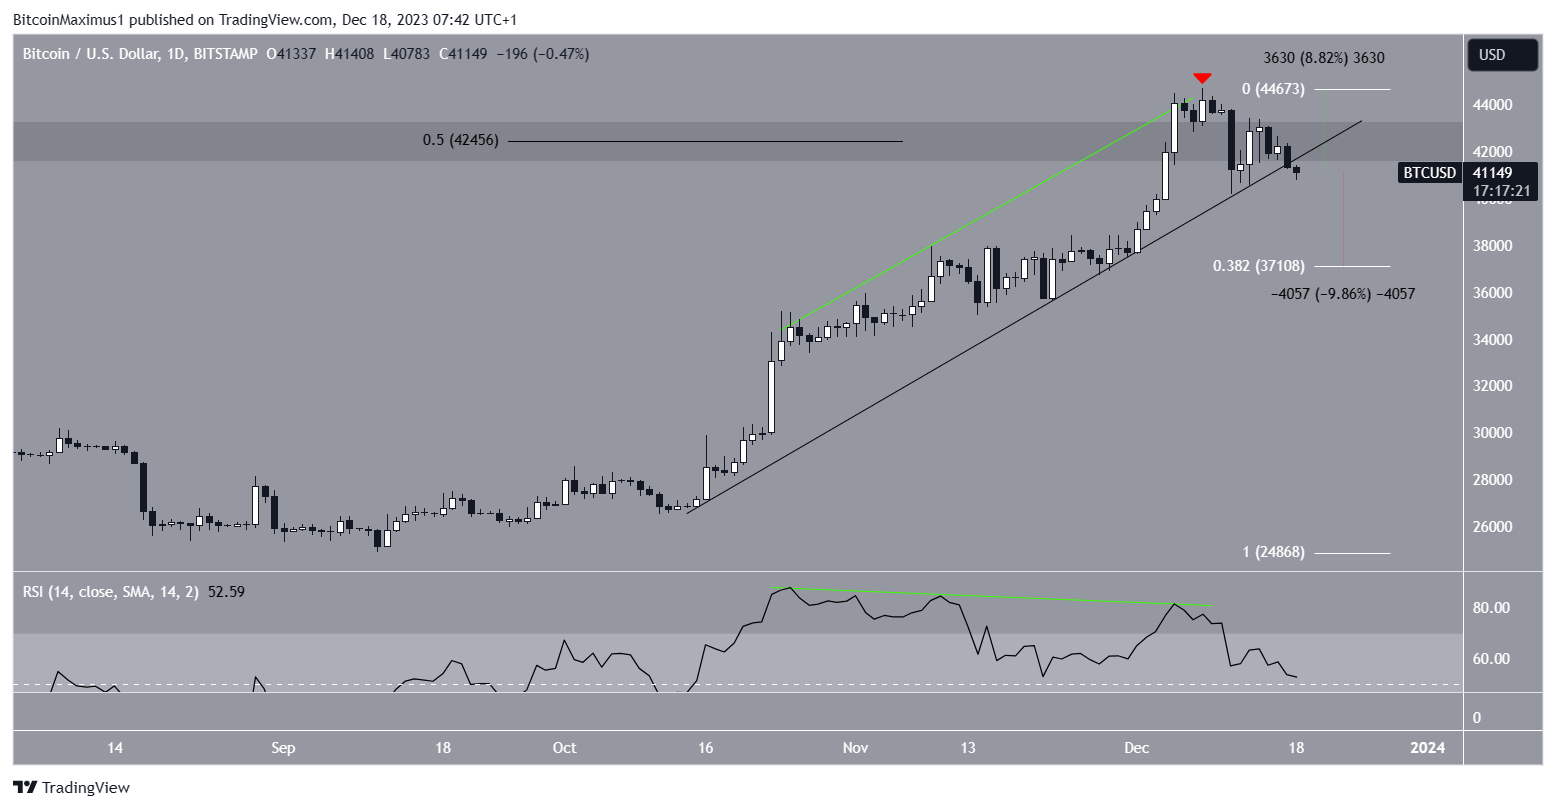
Similarly to TOTALCAP, the BTC price has increased alongside an ascending support trend line since October. The increase culminated with a new yearly high of $44,730 on December 8.
The price fell afterward, accelerating its decrease on December 11. The drop was preceded by a bearish divergence in the daily RSI (green). An important development in the Bitcoin price is that it deviated above the 0.5 Fib retracement resistance level at $42,450 (red icon).
After an initial bounce at the ascending support trend line, the BTC price created a lower high inside the resistance area. It is currently in the process of breaking down from the support trend line.
So, the most likely scenario is a 10% drop to the 0.382 Fib support at $37,100.
 BTC/USD Daily Chart. Source: TradingView
Despite this bearish BTC price prediction, a daily close above the ascending support trend line can cause a 9% increase to the yearly high of $44,700.
Read More: 9 Best Crypto Demo Accounts For Trading
Arweave Fails to Sustain Breakout
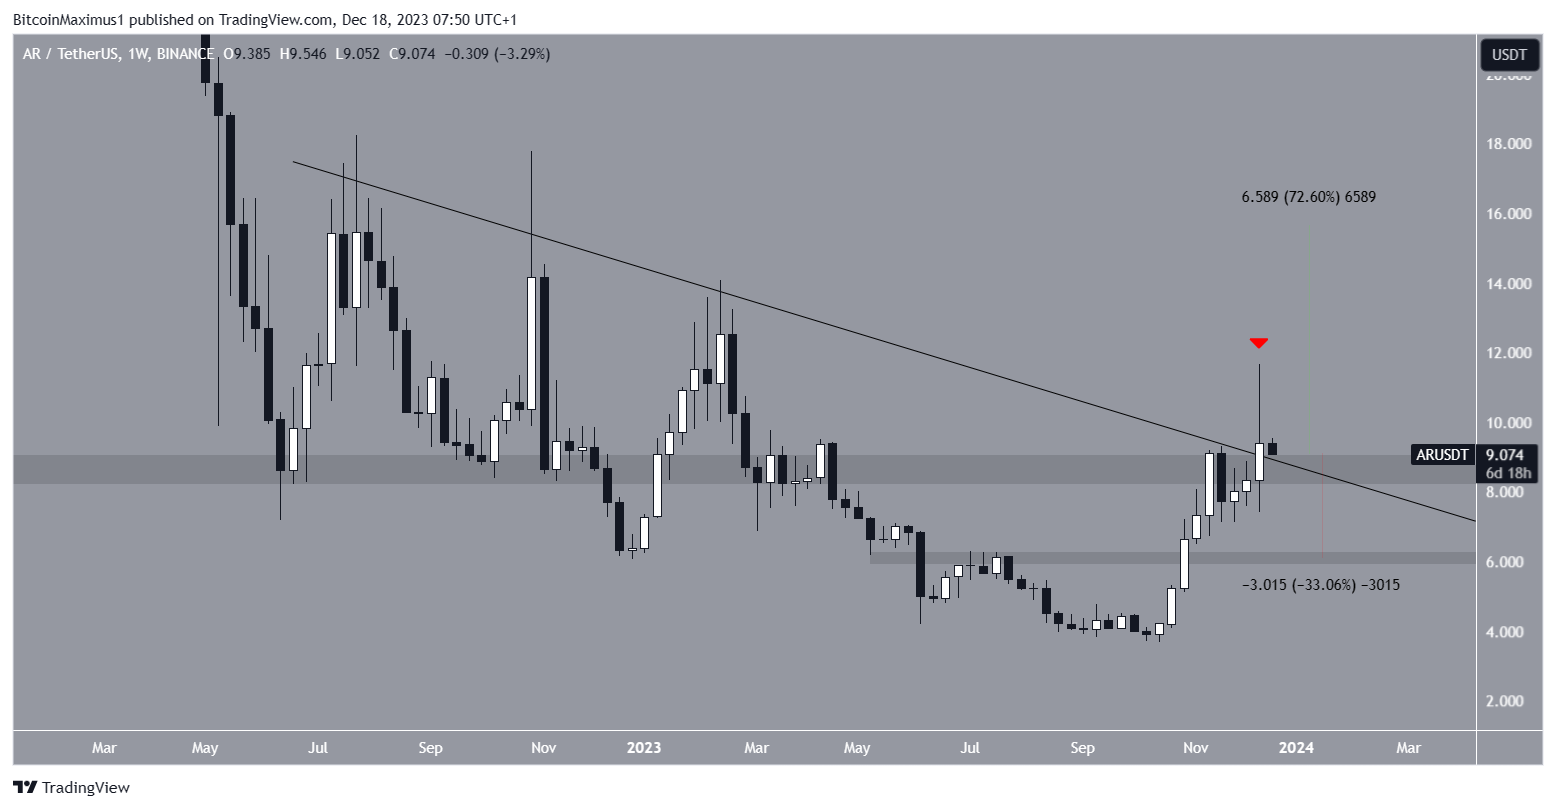
The AR price has increased quickly since October. While a long-term descending resistance trend line initially rejected it, the price moved above the resistance trend line last week.
However, it failed to sustain the increase, creating a long upper wick (red icon). The price has returned to the resistance trend line and the $8.50 horizontal support area.
Whether it bounces or breaks down can determine the future trend’s direction.
 AR/USDT Weekly Chart. Source: TradingView
A successful bounce can trigger a 70% increase to the next resistance at $15. On the other hand, a close below these support levels can cause a 30% decrease to $6.
Read More: Best Upcoming Airdrops in 2023
For BeInCrypto‘s latest crypto market analysis, click here.
Top crypto platforms in the US | December 2023
The post Why Is the Crypto Market Down Today? appeared first on BeInCrypto.
.png)
 1 year ago
3


 English (US)