ARTICLE AD BOX
The Bitcoin (BTC) price and the Crypto Market Cap (TOTALCAP) bounced yesterday, saving potential breakdowns. SEI reached a new all-time high.
In the news today:
- The U.S. District Court greenlighted a settlement against Binance and its CEO, Changpeng Zhao.
- A metaverse start-up sold its games services subsidiary for roughly $100 million.
TOTALCAP Saves Breakdown With Bounce
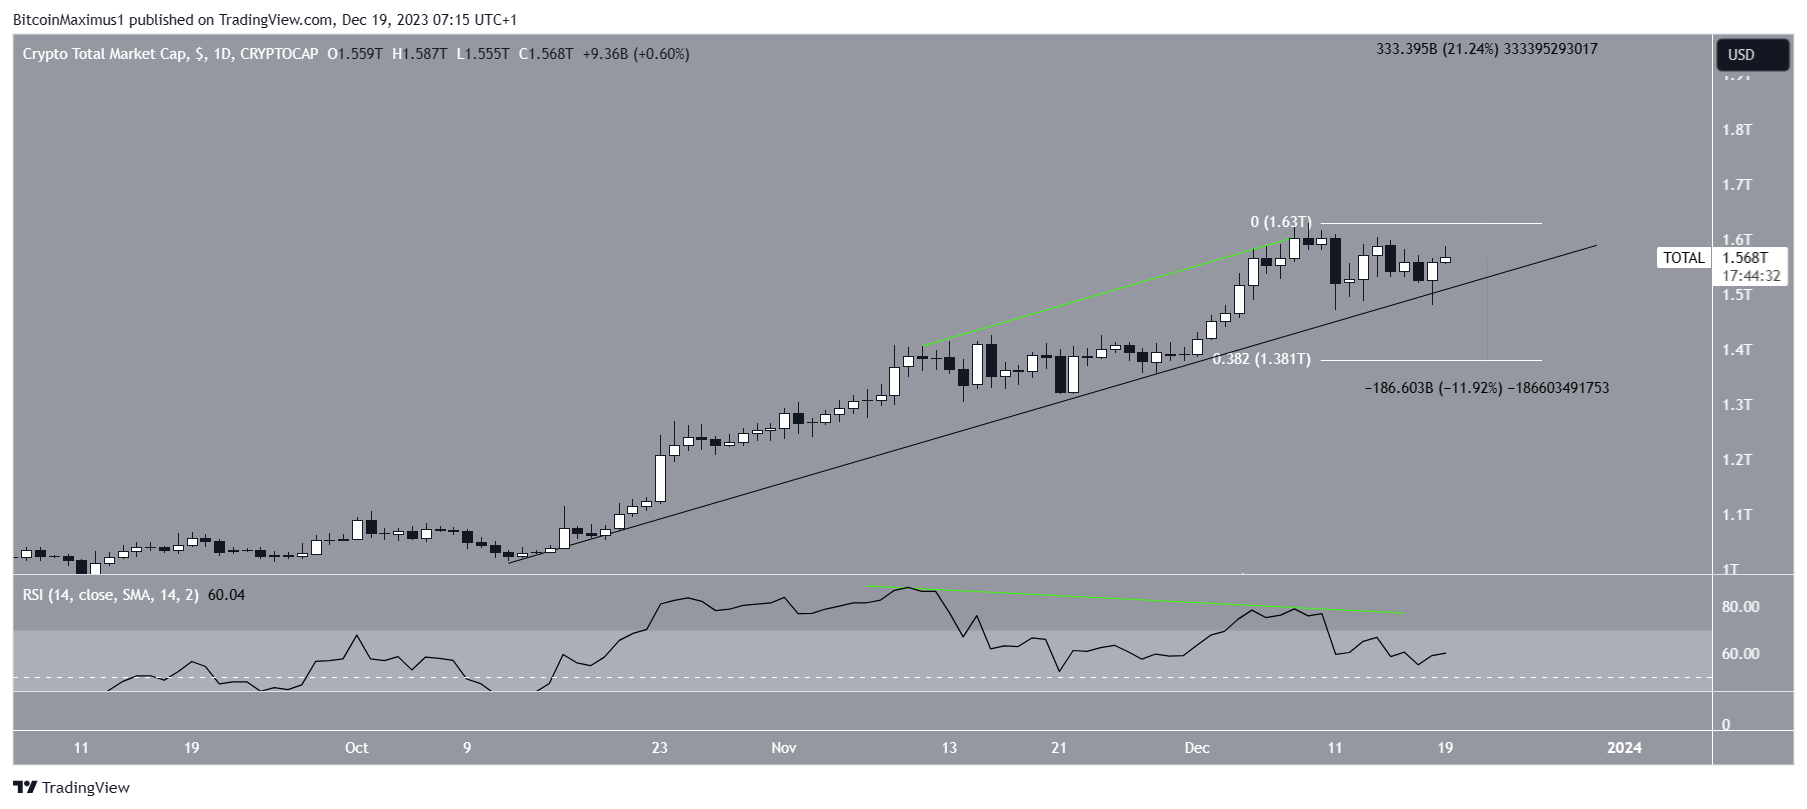
The cryptocurrency market cap has increased alongside an ascending support trend line since October. The upward movement culminated with a high of $1.63 trillion on December 9. This was an increase of 65% in the 89 days since the increase began.
However, the price fell sharply afterward, accelerating its decrease on December 11.
Market traders use the RSI as a momentum indicator to identify overbought or oversold conditions and to decide whether to accumulate or sell an asset. Readings above 50 and an upward trend indicate that bulls still have an advantage, whereas readings below 50 suggest the opposite.
The decrease was preceded by a bearish divergence (green) in the daily RSI. A bearish divergence occurs when a momentum decrease accompanies a price increase. It often leads to bearish reversals, as was the case with TOTALCAP.
However, TOTALCAP bounced yesterday (green icon), creating a bullish candlestick and saving a potential breakdown from the ascending support trend line. Whether the price breaks down from this trend line or moves above its yearly high instead will determine the future trend.
 TOTALCAP Daily Chart. Source: TradingView
A breakdown can lead to a 12% drop to the 0.382 Fib retracement support level at $1.38 trillion. On the other hand, increasing above $1.63 trillion can lead to a 20% increase to the next resistance at $1.90 trillion.
Bitcoin Creates Bullish Candlestick
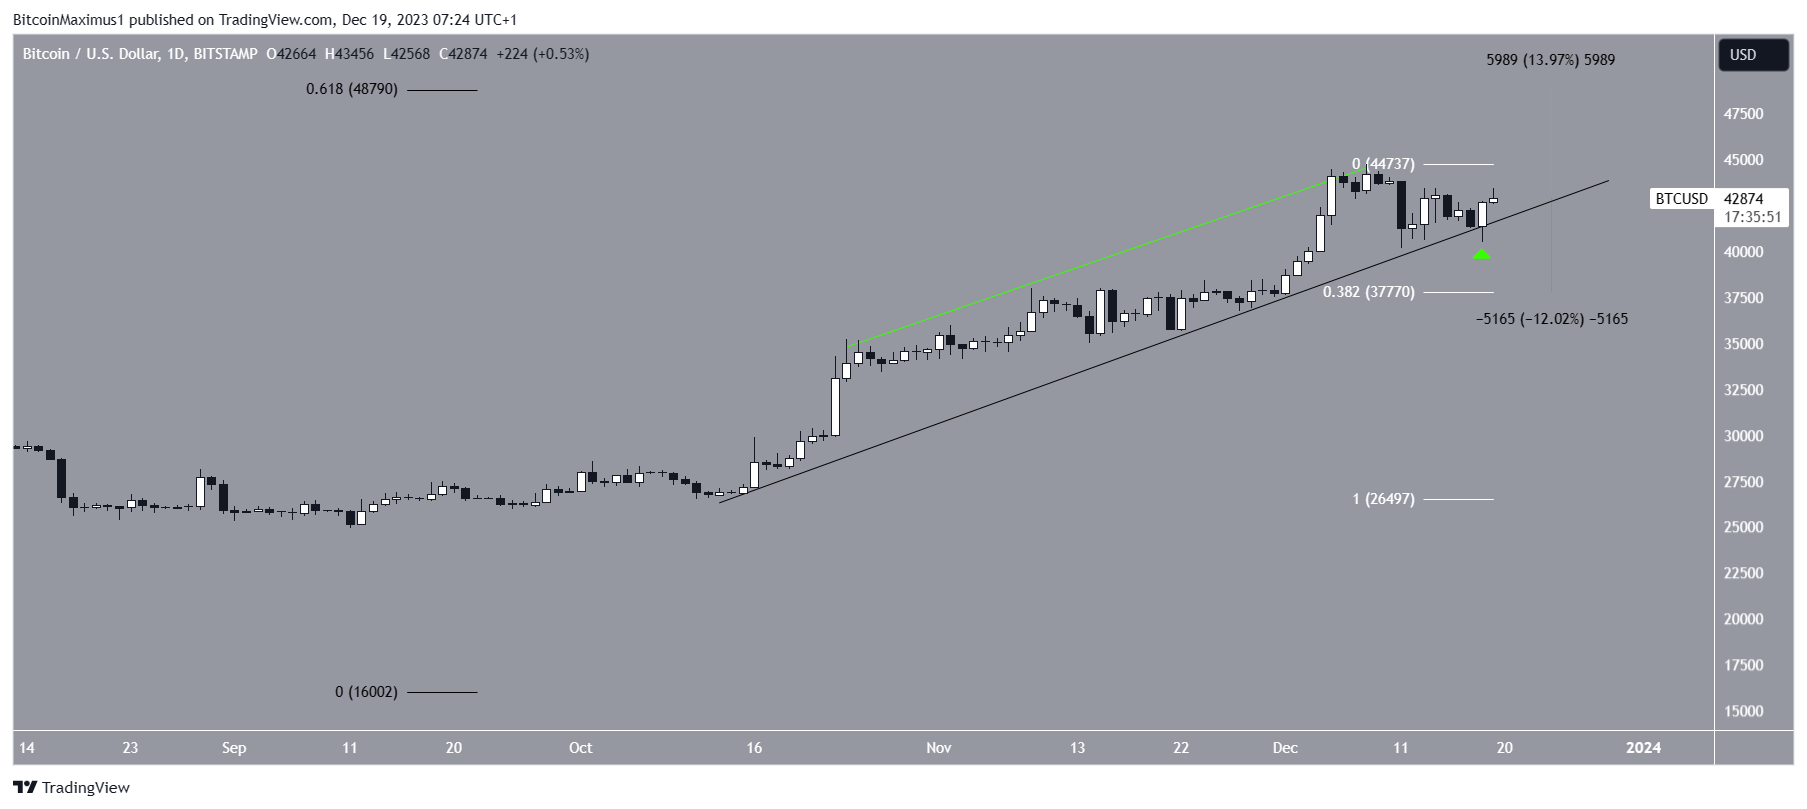
Similarly to TOTALCAP, the BTC price has increased alongside an ascending support trend line since October. The upward movement culminated with a new yearly high of $44,729 on December 8.
The price fell afterward after the RSI generated a bearish divergence (green).
While BTC initially fell below the ascending support trend line, it saved the breakdown with a strong bounce yesterday, which created a bullish candlestick. Whether the BTC price breaks down from the support trend line or instead resumes the bounce, reaching a new yearly high will likely determine the future trend.
 BTC/USD Daily Chart. Source: TradingView
A breakdown can cause a 12% decrease to the 0.382 Fib retracement support level at $37,800, while a new yearly high can trigger a 14% upward movement to the next resistance at $48,800.
Read More: 9 Best Crypto Demo Accounts For Trading
SEI Reaches New All-Time High
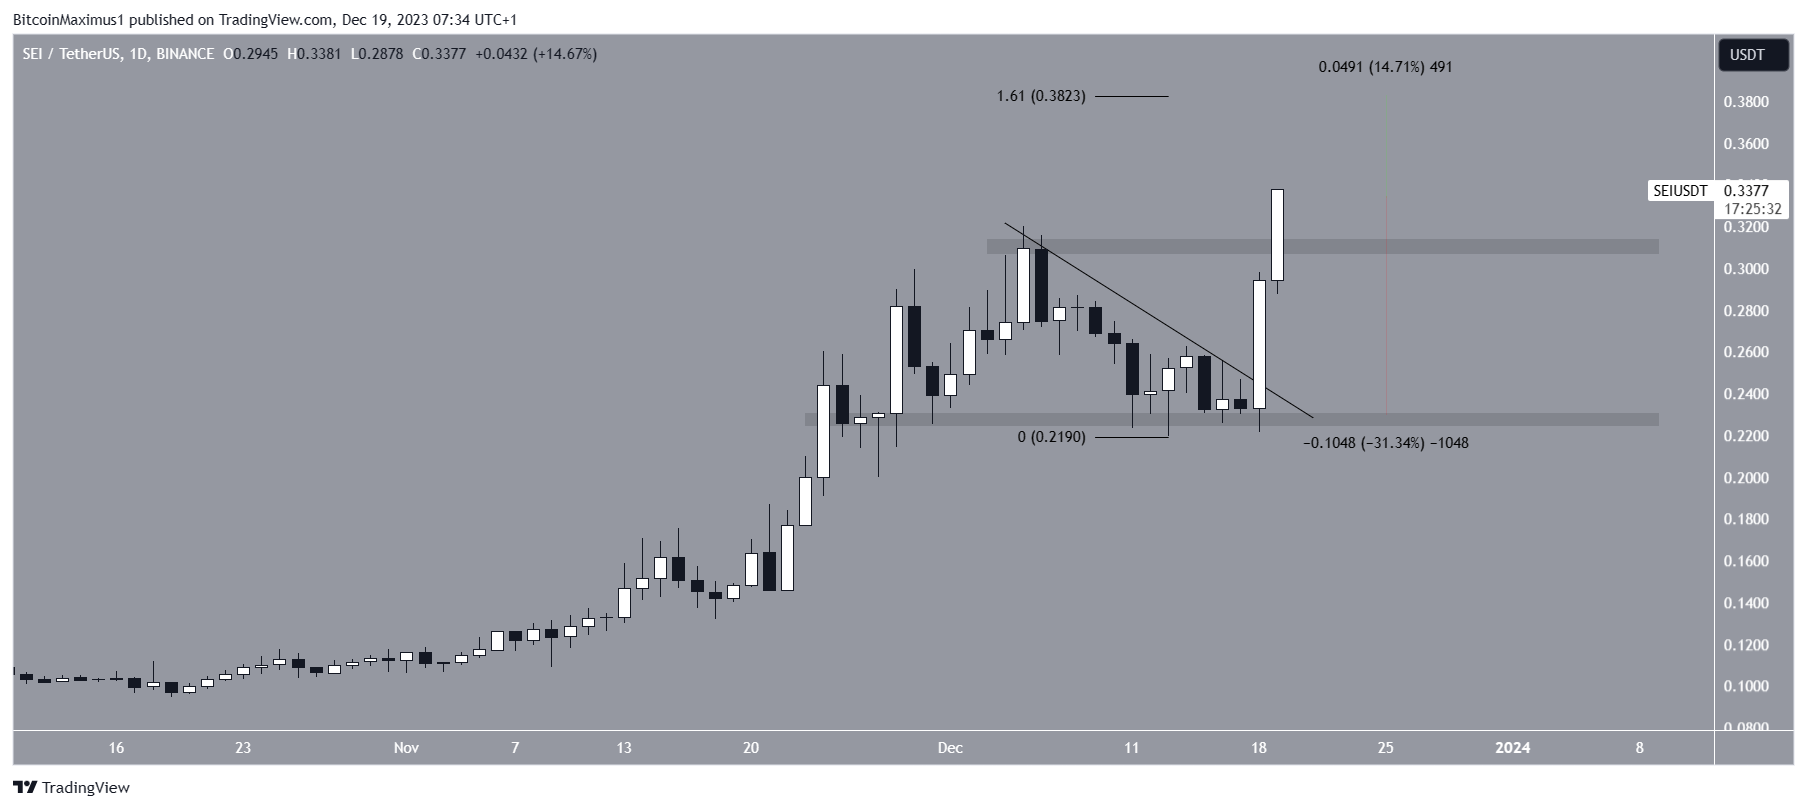
The SEI price had fallen under a descending resistance trend line since December 5. The decrease led to a low of $0.22 on December 13.
After creating a higher low, SEI created a massive bullish candlestick, breaking out from the trend line on December 18. Today, the altcoin reached a new all-time high of $0.34.
If the increase continues, SEI can reach the next resistance at $0.38, 15% above the current price. The resistance is found by the 1.61 external Fib retracement of the previous drop.
 SEI/USDT Daily Chart. Source: TradingView
Despite this bullish SEI price prediction, a close below $0.31 will invalidate the breakout. If that happens, SEI could fall by 30% to the $0.23 support.
For BeInCrypto‘s latest crypto market analysis, click here.
Best crypto platforms in Europe | December 2023
The post Why Is the Crypto Market Up Today? appeared first on BeInCrypto.
.png)
 1 year ago
4


 English (US)