ARTICLE AD BOX
The Polygon (MATIC) price has fallen under a long-term resistance trend line since its all-time high in December 2021.
MATIC also follows a short-term resistance trend line but trades above a horizontal support area.
Polygon Falls Under Long-Term Resistance
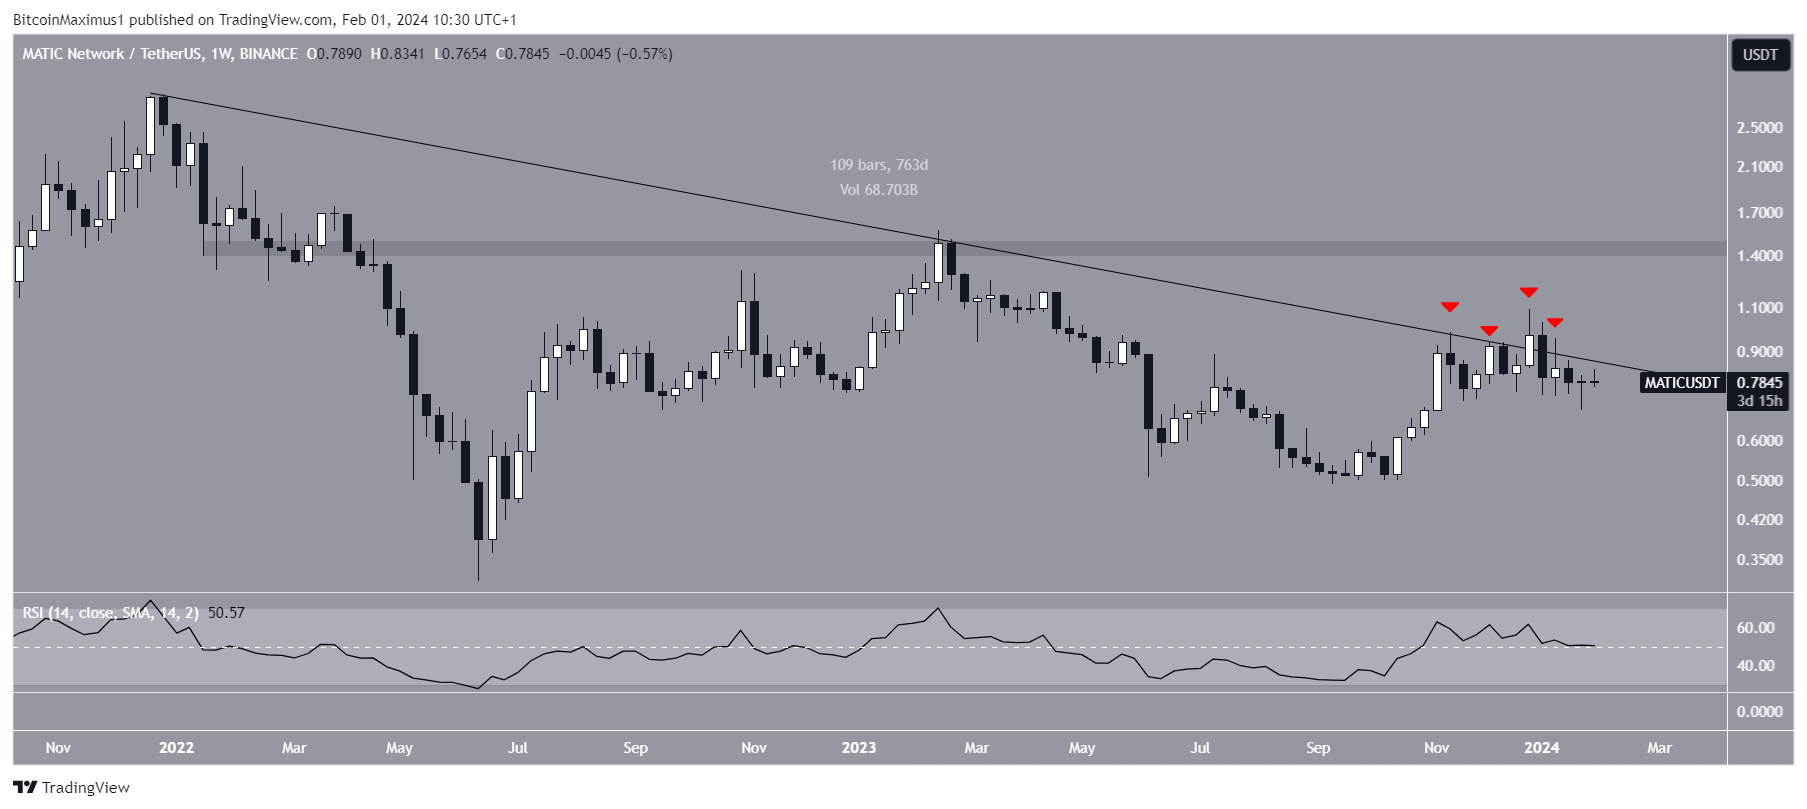
The technical analysis of the weekly time frame shows that the MATIC price has fallen under a descending resistance trend line since reaching its all-time high in December 2021. The downward movement culminated with a low of $0.32 in June 2022.
The MATIC price has increased since but still trades below the descending resistance trend line. Starting in November 2023, the price made four unsuccessful breakout attempts (red icons) before falling.
 MATIC/USDT Weekly Chart. Source: TradingView
The weekly Relative Strength Index (RSI) gives a bearish reading.
When evaluating market conditions, traders use the RSI as a momentum indicator to determine whether a market is overbought or oversold and whether to accumulate or sell an asset.
If the RSI reading is above 50 and the trend is upward, bulls still have an advantage, but if the reading is below 50, the opposite is true. The indicator is falling but is still above 50, a sign of an undetermined trend.
The Polygon team announced that they will hold a discord meeting tomorrow to discuss the benefits of AggLayer, more specifically stating:
The AggLayer solves this by unifying liquidity across chains, in an experience that will feel like a single environment.
The AggLayer uses ZK proofs to create a unified environment that feels like a single chain but maintains each chain’s sovereignty.
MATIC Price Prediction: Can Price Prevent Breakdown?
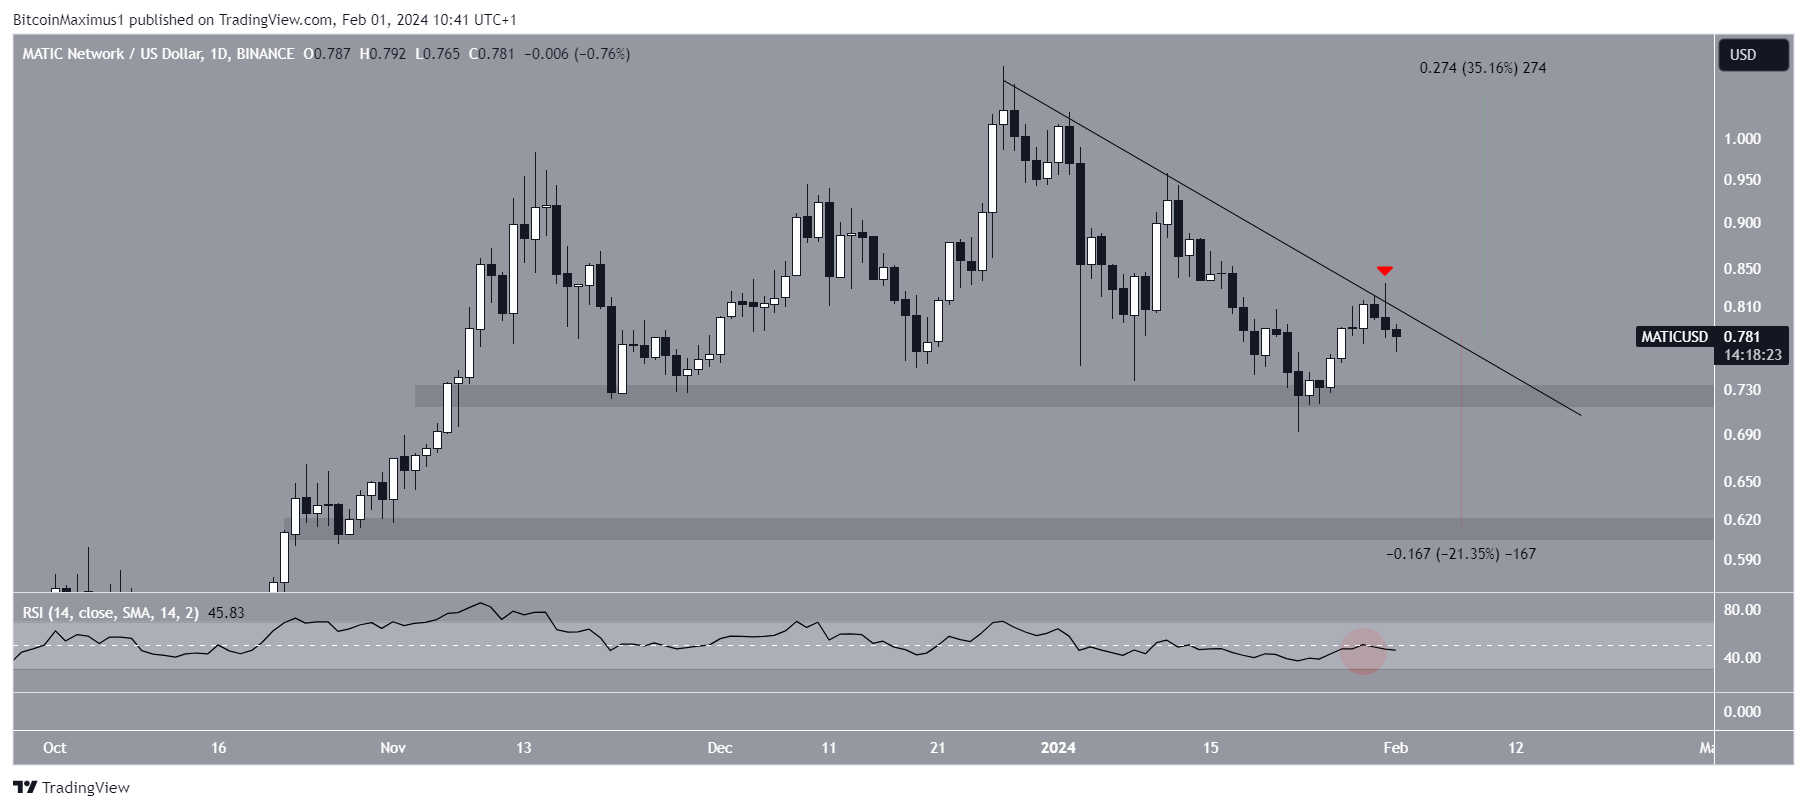
Similarly to the weekly time frame, the daily one gives a bearish reading because of the price action and RSI. It shows that MATIC has decreased under a descending resistance trend line since the start of the year.
More recently, the trend line rejected MATIC yesterday (red icon), creating a bearish candlestick. This aligned with a RSI rejection from 50 (red circle).
Cryptocurrency trader Crypto Rover noted the importance of the trend line, but he suggests the price will eventually break out.
Even though it trades below the descending resistance line, MATIC trades above the $0.72 horizontal support area, and it can fall 20% to the closest support at $0.60 if it breaks down.
 MATIC/USDT Daily Chart. Source: TradingView
Despite this bearish MATIC price prediction, a breakout from the trend line can trigger a 35% MATIC increase to the $1.05 high.
For BeInCrypto’s latest crypto market analysis, click here.
The post Will AggLayer Release Push Polygon (MATIC) Price Above $1? appeared first on BeInCrypto.
.png)
 9 months ago
2


 English (US)